Energy
Description
Energy features in Kaizen provide tools to monitor and manage your building’s energy consumption.
An Energy Meter is the basic building block of the Energy feature. There are different types of Energy Meters – meters created using Trend Logs from the BAS, or Calculated Trend Logs from Kaizen, or even virtual meters that do not require a Trend Log. Energy data when visualized could be viewed with an OAT Trend Log for reference.
Energy Meters can also be grouped together using Aggregate Meters to obtain a custom perspective on the building’s energy consumption e.g. by floor vs. by system/equipment.
Use the Energy page to quickly visualize your building’s consumption data.
Viewing Meters
With the Energy Meter structure in place, Kaizen provides a variety of ways to visualize consumption, detect faults at a high level, and then dig down to pin-point the exact time when the inconsistency occurred:
- Fixed time intervals include:
- Day, hourly aggregation [samples for each hour].
- Week, daily aggregation [samples for each day].
- Month, daily aggregation [samples for each day].
- Year, monthly aggregation [samples for each month].
- Custom:
- Any date range can be selected, with aggregation options of Daily or Monthly.

Energy Meter
You can create energy meters in Kaizen and visualize them using the Energy feature. These meters can be real consumption meters or virtual meters, providing you with the tools to monitor and manage your building’s energy consumption. You can use Kaizen Energy to visualize the consumption from different perspectives (e.g: individual meters, meter breakdown, total consumption on each floor, consumption associated with each type of load, etc.).
The Energy Performance and Breakdown features give you a granular view of your consumption. The Baseline Comparison feature can be used to compare your consumption against historical usage data, and the Target Comparison displays a user-definable positive or negative percentage of historical data.
Meter Settings
The Settings feature in Kaizen Energy is used to create, edit and delete different types of Energy Meters. The following types of meters are available for your use:
- Aggregating meter: An aggregating meter is a virtual meter that gives the sum of all sub-meters as its output.
- Trend Log meters: The Trend Log meter is an energy meter that uses a real or Calculated Trend Log as input.
- Variance meter: Another virtual meter that displays the difference between the parent meter and sum of the other sub-meters as its output.
Energy Performance
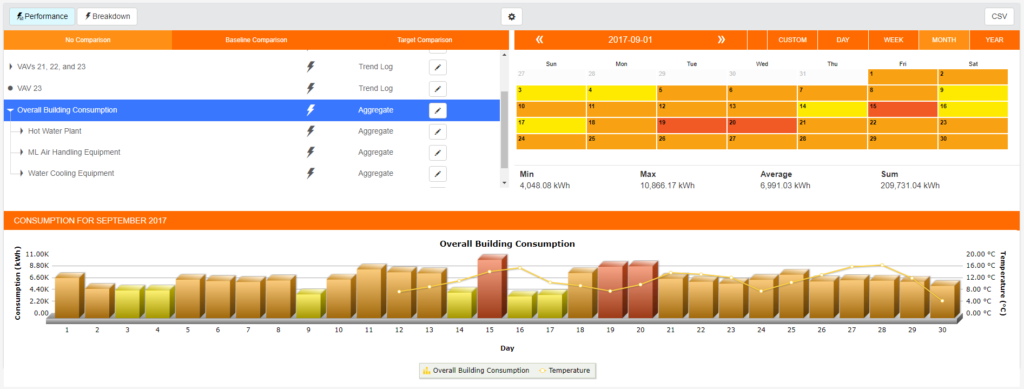
When you select an Energy Meter, the Energy Performance feature displays the consumption as a bar chart. The performance can be viewed for a day, week, month, year, or a custom date range of your choosing. Kaizen’s analytic engine will highlight the days of high and low usage using the different colors which are shown in the legend below the calendar.
Low and High Energy Usage
The Low and High reflect the bottom and top 20% of the range. e.g. for values of 100,101,102,103,104, 150, 200.
The Lowest usage is 100 kWh and Highest is 200 kWh.
Range = 100kWh
20% of the range is 20
The low range is 100 – 120
The high range is 180-200.
Energy Breakdown
The Breakdown feature breaks down the total consumption of the selected meter into individual sub-meter consumption. This way, you can view the distribution of energy consumption per floor, load types, etc.
Baseline Comparison
The baseline Comparison feature is used to compare your current energy consumption to a baseline. For example, this feature can help you visualize the energy savings that you have achieved after an engineering retrofit in your building by comparing the current consumption to the consumption before the retrofits. The offset of data for baseline has allowable options of:
- 1 week
- 2 weeks
- 1 month (4 weeks)
- 1 year (52 weeks).
Month and Year are defined as weeks so that days are aligned ( Sundays are always compared with Sundays, Mondays with Mondays).
Target Comparison
The Target Comparison feature is used to compare current or historic consumption with a target. The target is adjustable as a positive or negative % change from last year’s values. For Targets to work properly, your meter must have data from the year previous to your comparison period. The target can be set both as a static value when defining a TL meter, but can also be changed temporarily in the graph controls to perform what-if scenarios.
CSV and PDF export
The CSV and PDF export feature allows you to export energy data as a CSV file or a PDF file. You can export any Energy Meter data in Kaizen by entering a Date Range and Aggregation Interval (sample frequency). The PDF export gives you a PDF file of the Energy page so that you can use the same in your Energy reporting (e.g.:monthly, quarterly reporting).
Energy Insights
Energy Insights are generated by collecting data from your Building Automation System (BAS) and sending it to CopperTree’s analytic engines to let you graph energy meters (accumulating TL) and easily select data period and detail level. Outcome(s) of Energy Insights can be used to display energy data in public dashboards via Kaizen public API.
Energy Trend Log(s) undergo data transformations performed in logic flow with aggregation intervals on request and replacing negative values with zero values. Historical consumption baselines are calculated with the use of the offset series to calculate energy target values.
All insights produce data that is available on request, such as filtered and aggregated data. These TL(s) are not automatically output by the insight unless specified otherwise in the table below.