Cumulative 2-Input (Stacked)
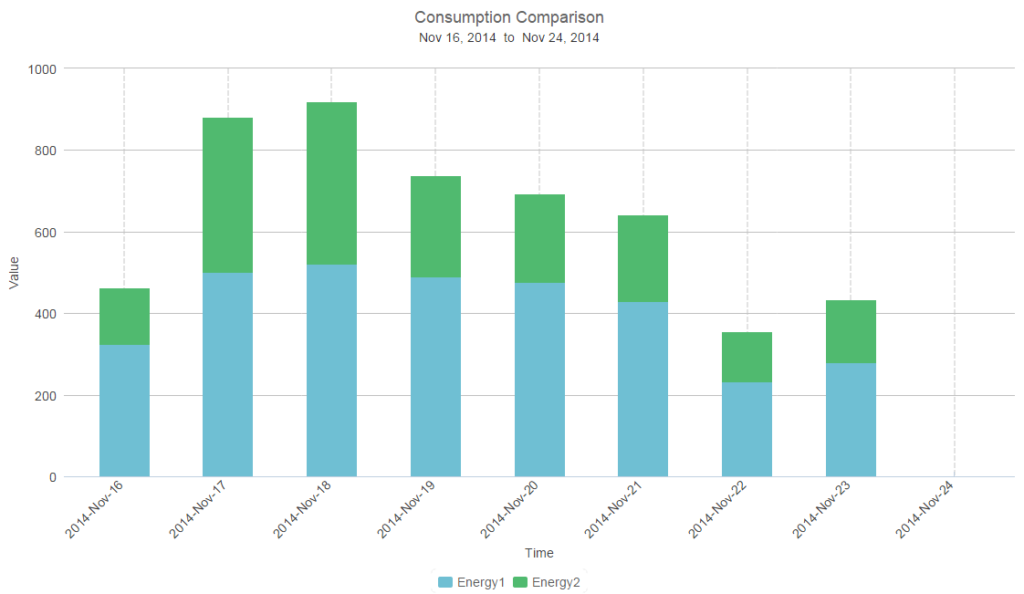
Description: Compares the growth characteristics of two cumulative inputs, scaling the data based on the user’s specified time interval. Inputs are stacked one on top of the other, to show total consumption for both meters. The data table provides the consumption breakdown for both individual inputs and their sum.
Example: This chart template is used to compare the individual and total consumption of two individual meters over a user-selectable range. The two inputs are graphed as bars, placed stacked on each other to display the total energy consumption. This chart also allows the user to break down the usage with aggregation intervals associated with the selected date range.
- Chart type: Stacked Column
- Input type: Cumulative
- No. of Input meters: 2
- Suitable for: Energy
- Default Units: kWh
Outputs: Delta, Sum of Period
Special Characteristics: Stacked
Tags: Consumption, Comparison, Combined, Absolute, Meter, Bar, 2-Input
