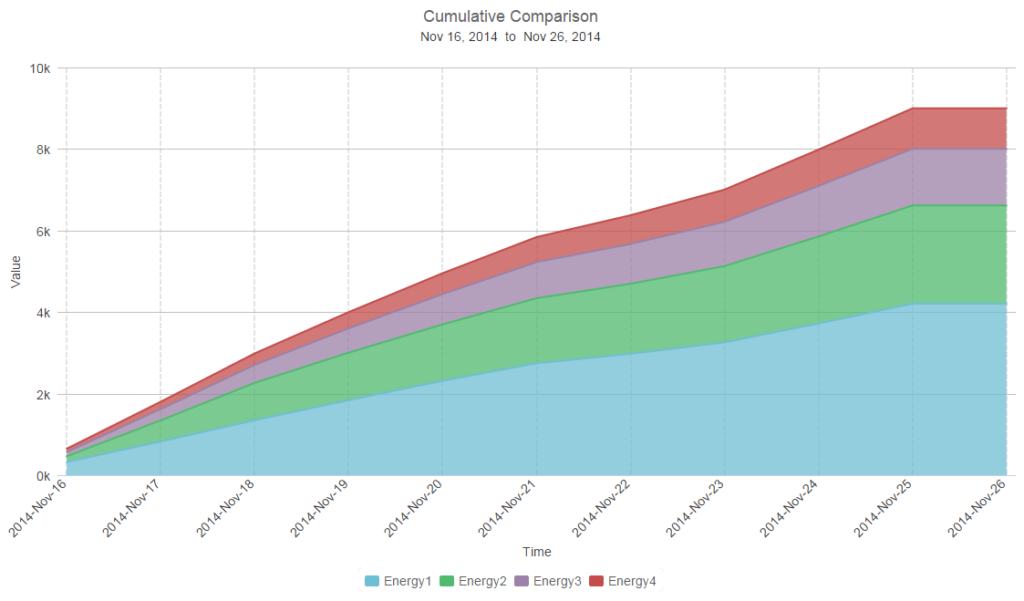
Description: Accepts 3 cumulative TLs as input. Plots the growth of all meters over a user-specified time interval, allowing you to see both their relative growth, and the total growth for all meters.
Example: This chart template is used to compare the individual and total energy consumption for three individual meters over a user-selectable range. The three inputs are graphed as an area chart.
- Chart type: Area
- Input type: Cumulative
- No. of Input meters: 3
- Suitable for: Energy
- Default Units: kWh
Outputs: Delta, Growth Over Period
Special Characteristics: None
Tags: Consumption, Comparison, Combined, Absolute, Line, 3-Input