The Connector Registry page can be used to register new K-Links and view the current inventory and data health of the deployed devices. This page uses TL Health Baseline and K-Link Heartbeats.
Navigate to the Connector Registry page by clicking on the Registry Icon.
The information on this page can be filtered based on the following criteria:

- Online: Devices that are transmitting heartbeats to Kaizen are categorised as Online.
- Online with Partial Information: Devices with yellow heartbeat icons are Online but with partial information. This may be because timestamps are coming through but the device’s heartbeat is not what is in the Kaizen database.
- Offline: Devices with no heartbeat are coloured red and categorised as Offline.
- Never Online: Devices that have never registered a heartbeat with Kaizen are categorised as Never Online. Never Online devices are represented by a grey-ed-out heartbeat.
- Building Status Filter: This Shows buildings where status is set.
Clicking on the “Export” button can be used to download the information on the registry, with any filters used.
The Connector Registry Page has two views that can be used to categorize the Connectors.
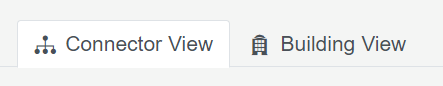
- Connector View: This breakdown of the data health on the basis of Connectors. This view can be helpful to visualize the status of trend logs and comparison to the baseline. This view includes:
- Connection: This is an ID created for the Connector by Kaizen. This cannot be changed and is created when the K-Link is added.
- Connection Name: This is the name given to the Connector.
- Deployed to: This is the client for which the connection was created.
- Building(s): These are the buildings for which mappings exist in the Connector. Building Mappings can be created by following the steps here.
- Building TLs vs Healthy baseline: It compares the Building TLs to Healthy Baseline.
- Building Last Sample: This is the latest date on which a trend log was updated to Kaizen. If the building has never been online, this field will be blank.
- Building Status: This field shows the current status of the building on Kaizen. Click here to view details about Building Statuses.
- Healthy Trendlog: This shows the aggregate of the Trend Logs currently reading. In this view, the Healthy Trendlog adds all the TLs from the buildings it is mapped to.
- Baseline Trendlogs: The baseline TL count is designed to increase as more TLs are discovered and updated for the building and is done automatically. The baseline is set to the maximum number of healthy TLs received to date. The baseline can be set to a lower value manually by following the steps here.
- UnHealthy Trendlogs: This is a count of the trend logs that have not been read for at least the last 48 hours.
- Unhealthy % of Baseline: This field calculates the percent of trend logs that are unhealthy as compared to the baseline.
- Last Heartbeat: This field shows the last logged heartbeat that the Kaizen server received from the Connector.
- View: This field has an eye icon that can be clicked on to navigate to the Connector registry page for the device which contains all the information for the device.
- Building View: This view breaks down the connector health information based on buildings. This view may be useful for trend log information as per buildings. If a Connector is deployed to two or more buildings, there will be duplicates of the Connector. This view has the following columns:
- Client: This is the client to which the building belongs. This field is linked to the client dashboard.
- Building: This is the building which the Connector is under. This building is to which the connector is mapped.
- Connection ID: This is the unique ID created for the connection by Kaizen. Click on the ID to reach the Connector Registry page of the connection.
- Last Heartbeat: It shows the last time a heartbeat was registered for the connection.
- Last Sample: This shows the last time a TL was logged into the building.
- Building Status: This field displays the status of each building. To know more about Building statuses click here.
- Healthy Trendlogs: This field shows all the trendlogs that have updated data in the last 48 hours.
- UnHealthy Trendlogs: This field shows the sum of trendlogs that have been read in the past but are currently offline.
- Baseline Trendlogs: This is the maximum number of trendlogs read that have been received to date.
