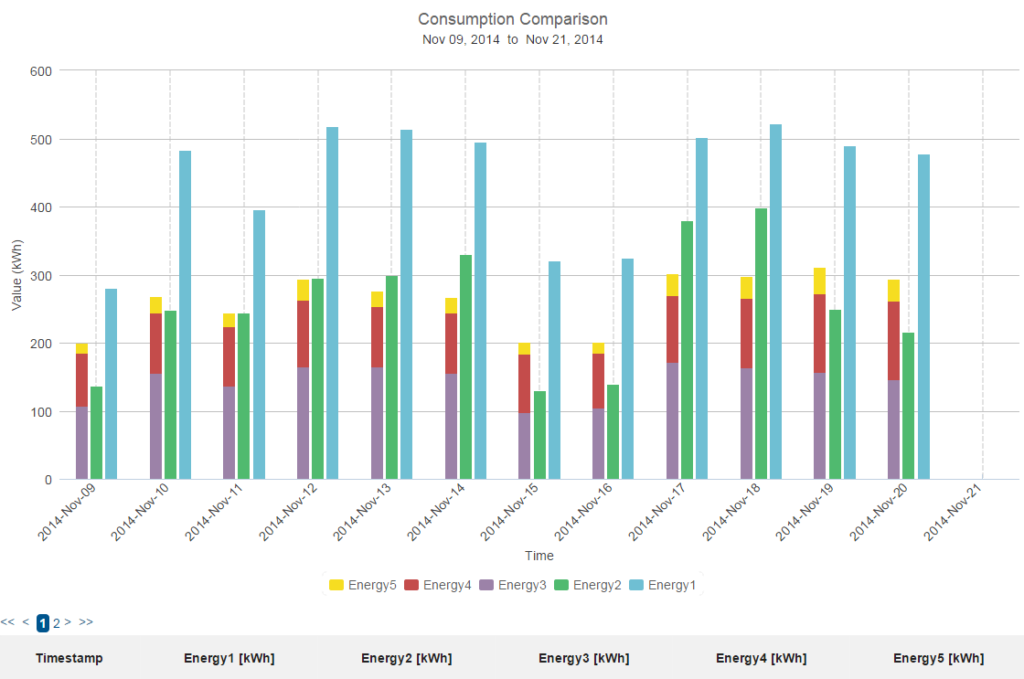
Description: Compares the growth characteristics of five (5) cumulative inputs, scaling the data based on the user’s specified time interval. The first three inputs form the right-most bar, and inputs 4 and 5 form the left-most bar. The data table provides the consumption breakdown for the individual inputs.
Example: This chart template is used to compare the consumption of five individual meters over a user-selectable range. The consumption of the first 3 meters is graphed as a stacked column, the last 2 meters are graphed in a separate stacked column.
- Chart type: Column, Stacked Column
- Input type: Cumulative
- No. of Input meters: 5
- Aggregation Type: Sum
- Table Summary: None
- Suitable for: Energy
- Default Units: kWh
Outputs: 5 – Delta, Sum of Period
Special Characteristics: Stacks first three meters, then stacks the next two beside in another bar
Tags: Consumption, Comparison, Combined, Absolute, Meter, Bar, 5-Input