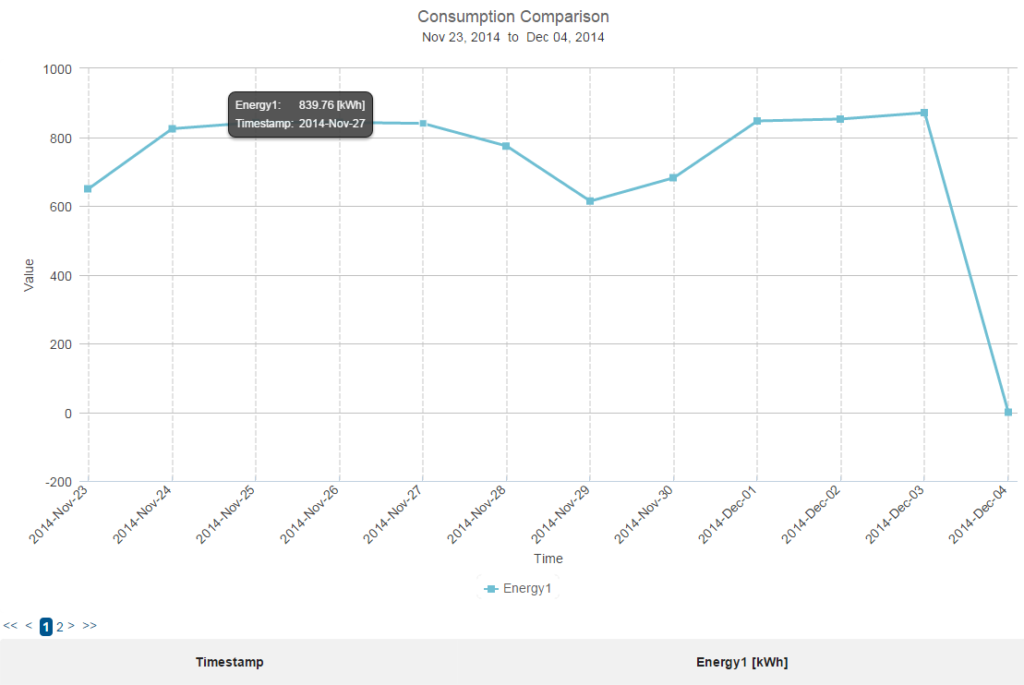
Description: Accepts an input trend log, and aggregates (averages) the data over a requested interval, before displaying it as a line chart. Uses a line-series type display, perfect for time-based comparisons.
Example: By supplying the graph with, for instance, a temperature trend log, and setting the view period to last week, you will see a line chart of daily average temperatures.
- Chart type: Line
- Input type: Non-Cumulative
- No. of Input meters: 1
- Suitable for: Energy, FDD, Integrity
- Default Units: kWh
Outputs: Request Average
Special Characteristics: None
Tags: Comparison, Seperate, Absolute, Temperature, Line, 1-Input