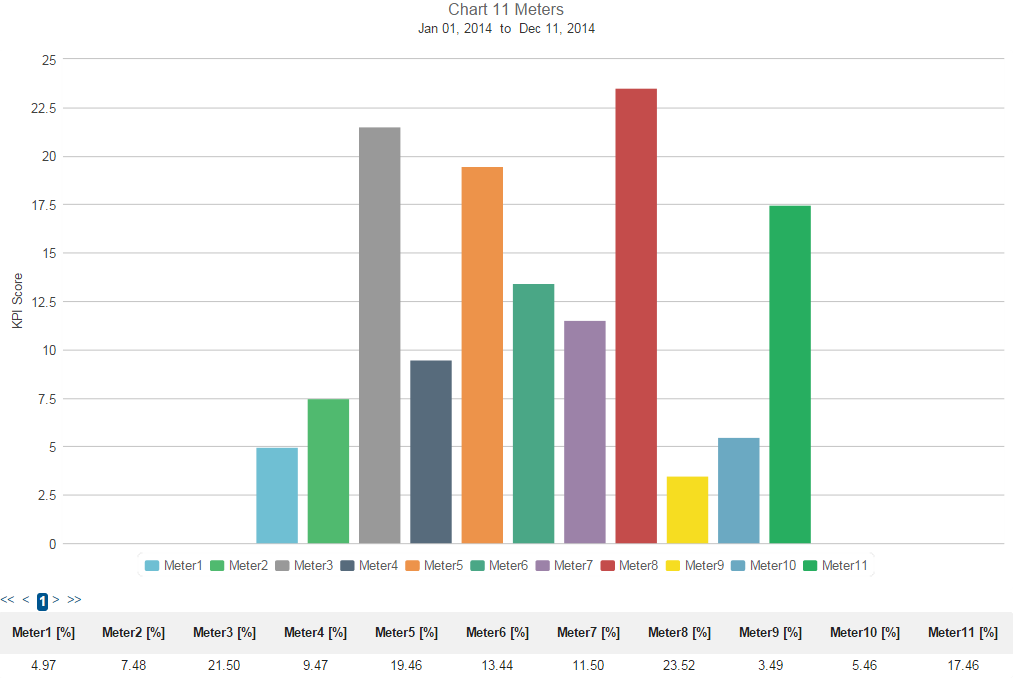
Description: Displays the average of 11 different trend log inputs, as a bar chart. The table provides the numeric average of each of the 11 inputs over the viewing period.
Example: This chart is used to display the average KPI score for 11 different systems over a user-selected range.
- Chart type: Custom
- Input type: Cumulative or Non-Cumulative
- No. of Input meters: 11
- Aggregation Type: Average
- Table Summary: Average
- Suitable for: KPI, Energy, FDD
- Default Units: NA
Special Characteristics: No time-stamps displayed
Tags: Comparison, Separate, Average, Bar, 11-Inputs