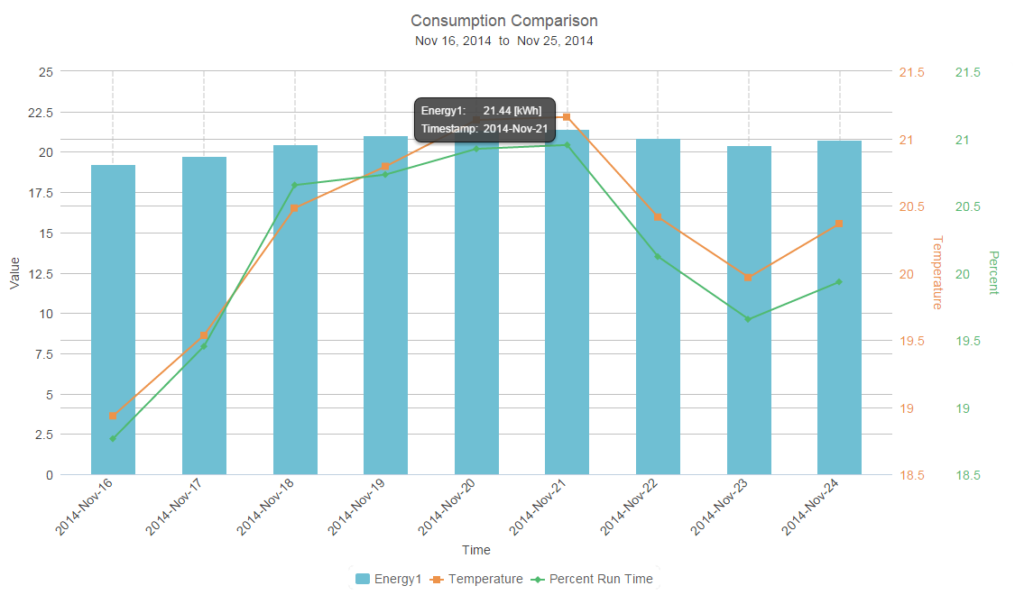
Description: Displays first input as a bar chart scaled (averaged) over a requested time period, and overlays 2 scaled line series on top. Default line series are Temperature (degrees Celsius), and Percent Run-time. The Table Summary at the bottom of the page has 4 possible summary functions, namely Minimum, Maximum, Average, and Sum.
Example: Supply system run-time percentage, temperature, and energy consumed on desired intervals. A graph that correlates the relationship between energy consumption, temperature and system run-time is shown.
- Chart type: Line, Column
- Input type: Non-Cumulative
- No. of Input meters: 3 +Temperature +%RunTime
- Suitable for: Energy, FDD, Integrity
- Default Units: kWh, deg C, %
Outputs: Average of Selected Period
Special Characteristics: None
Tags: Comparison, Separate, Absolute, Bar, Temperature, Baseline, Line, 3-Input, Multi-Axis