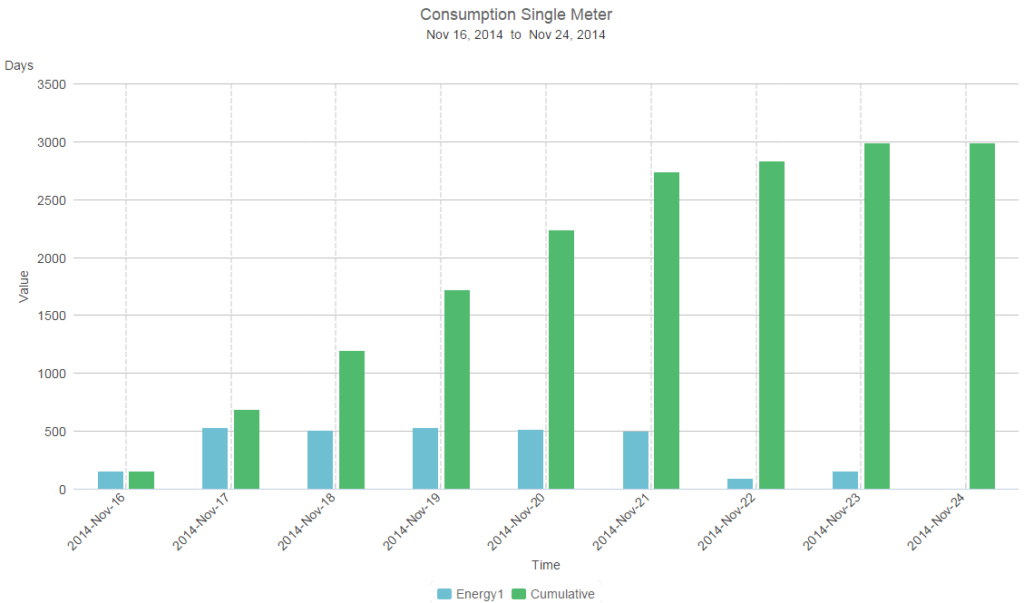
Description: Accepts a cumulative trend log. Calculates differences between subsequent data points, aggregates them (sum) and plots the input distribution (bar 1) and cumulative total (bar 2) over a requested period.
Example: This chart template is used to display the energy usage for a single meter. One bar displays the usage for the individual aggregation interval, the second bar displays the total energy usage from the start time period.
- Chart type: Column
- Input type: Cumulative
- No. of Input meters: 1
- Aggregation Type: Sum
- Table Summary: None
- Suitable for: Energy
- Default Units: kWh
Outputs: Delta, Periodic Accumulation
Special Characteristics: Displays both per bucket consumption and growing consumption over a period
Tags: Consumption, Seperate, Absolute, Meter, Bar, 1-Input, Cumulative