Description
The Linear Regression Logic Block is used to build models for the behavior of a data series based on how it has been affected by other data series historically.
Functionality
Inputs: The first input, appearing as a top-most entry in the Logic Block’s list of inputs, is the data series we are trying to build a model for. This is also known as the dependent variable. The remaining inputs are data series, whose behavior somehow affects the data series we are trying to model; e.g. OAT and occupancy TL for modeling energy demand. These are referred to as independent variables.
Output: The output of the Linear Regression Logic Block is a modeled data series. The values are calculated using the method of ordinary least squares, where the coefficients are derived from historical patterns of the data series.
Block Configuration
The Linear Regression Logic Block can operate in two modes: with absolute and relative ‘training ranges’ described below.
Name: sets the name of the block as it appears in the logic flow. It is best practice to use a concise, descriptive name.
Training Range: Defines the historical period when the relationship between input data series will be analyzed. This, in turn, determines regression coefficients.
- Absolute: the coefficients calculated for the training range will be used for the entire model.
- Relative: when a request is made to the Linear Regression Logic Block, the requested range will be offset by the configured amount, and the coefficients for variables will be computed based on the values in the offset range. Data will then be requested for the actual range, and the dependent variable will be predicted using the computed coefficients.
Examples
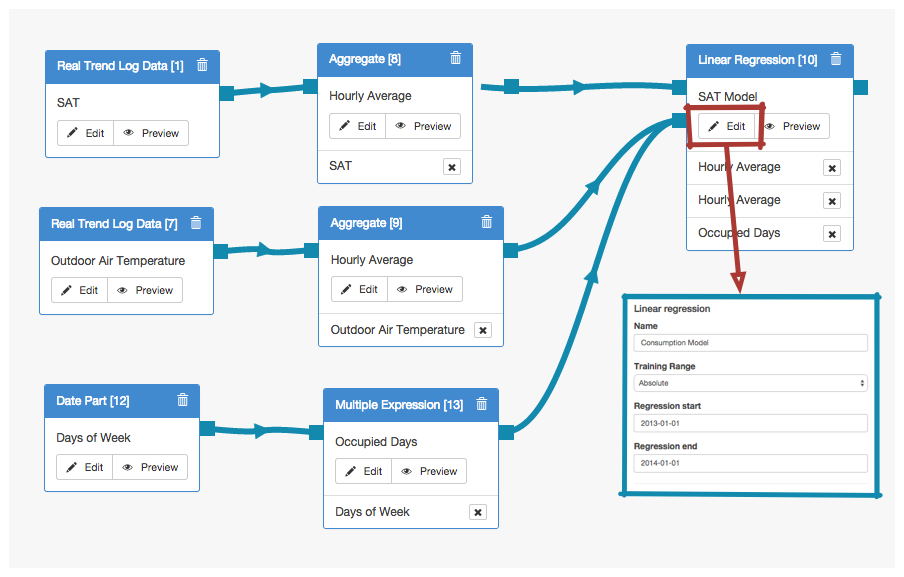
Absolute Range: In this simple example we will construct a model for the supply air temperature (SAT) using an absolute training range. SAT is the dependent variable. The independent variables are the Outside Air Temperature (OAT) and the Occupied Days.
The absolute training interval is defined from January 31, 2013, to January 31, 2014.
Hence, the regression logic series uses an algorithm to determine how the OAT and Occupied Days affect the Supply Air Temperature over the year from January 31, 2013, to January 31, 2014. Then, given values for the OAT and the Occupied days, the regression logic series attempts to predict what the SAT should be, based on the relationship determined in the interval.
The output of the Linear Regression Logic Block is a mathematical model for SAT that can be used as a reference baseline.
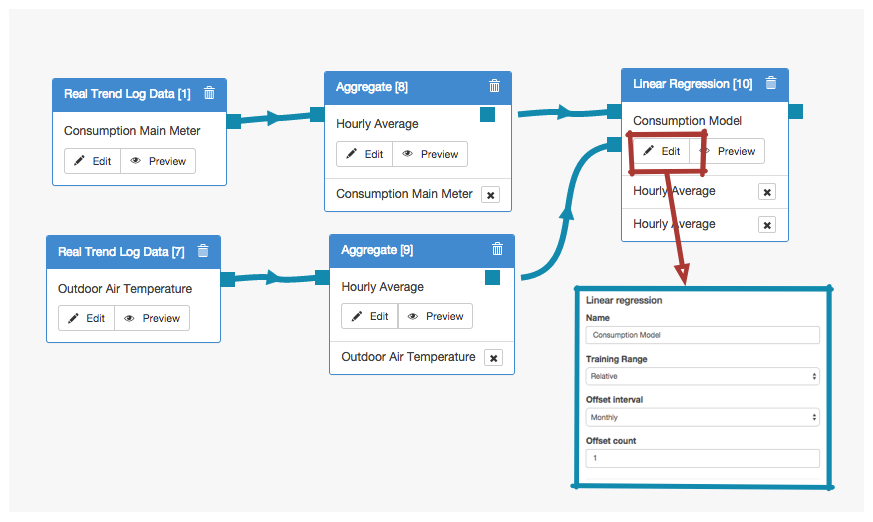
Relative Range: Here, a baseline for a consumption meter is calculated using a linear regression model with a relative training range.To predict consuption, the logic flow uses a model created by examining the relationship between consumption and outdoor air temperature during the month before.