Description
Meters are graphics that can be implemented in Kaizen to visualize a performance indicator. Meters are managed at the Energy Dashboard.From the Home page, navigate to the building that you want to add meters in. This can be done by either:
- Selecting your building from the list of Favorite Buildings on the Kaizen Home page
- Searching for your building in the Navigation Tree [
 ], located on the left hand side of the screen
Clicking on your Building takes you to the Building Dashboard.From the Building Dashboard page, click on ![]() Energy to access the Energy Dashboard
Energy to access the Energy Dashboard
Create an Energy Meter within the Energy Dashboard
The Energy Dashboard provides a powerful way of monitoring a building’s energy consumption. Custom Energy Meters can be created based on both real consumption meters and virtual meters. This article will provide step-by-step instructions to create Energy Meters in Kaizen. It is possible to organize Energy Meters in a tree-like structure and then visualize the data as individual meters or as a group. Please note that all Energy Meters within a tree must be of the same type and have the same units. E.g. You cannot create a Gas Meter as a sub-meter of an Electricity Meter.
Adding a new Meter
From the Energy Dashboard:
- Click

- To add a new Meter you can either:
- Click the main
 to create a new Energy Meter Tree
 - Click the on one of the existing Meter Trees in order to create a sub-Meter under the selected Meter Tree
- Click the main
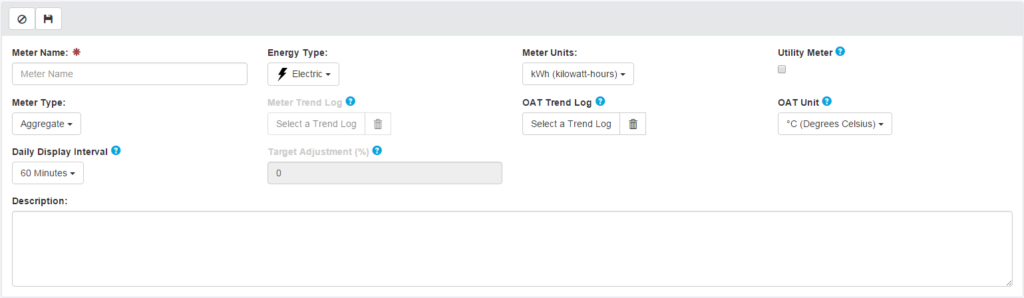
- Enter the required Meter information
- Click
 .
.
View the Energy Breakdown for your Meters
The Energy Dashboard provides the Energy Breakdown feature that can be used to visualize the breakdown consumption of your meters. If you have a parent meter A with sub-meters AA, AB, and AC – then using the Energy Breakdown feature, you can view how much of the total consumption is associated with each of the sub-meters.
From the Energy Dashboard:
- Click on
 BREAKDOWN to access the Breakdown Comparison page.
 - Select the meter that you would like the Energy Breakdown for. This will show you the breakdown. You can select the view that you desire – day, week, month, or year. The total consumption of the main meter will be displayed as well.
- Fixed time intervals include:
- Day, hourly aggregation
- Week, daily aggregation
- Month, daily aggregation
- Year, monthly aggregation
- Custom:
- Any date range can be selected, with aggregation options of Daily or Monthly
