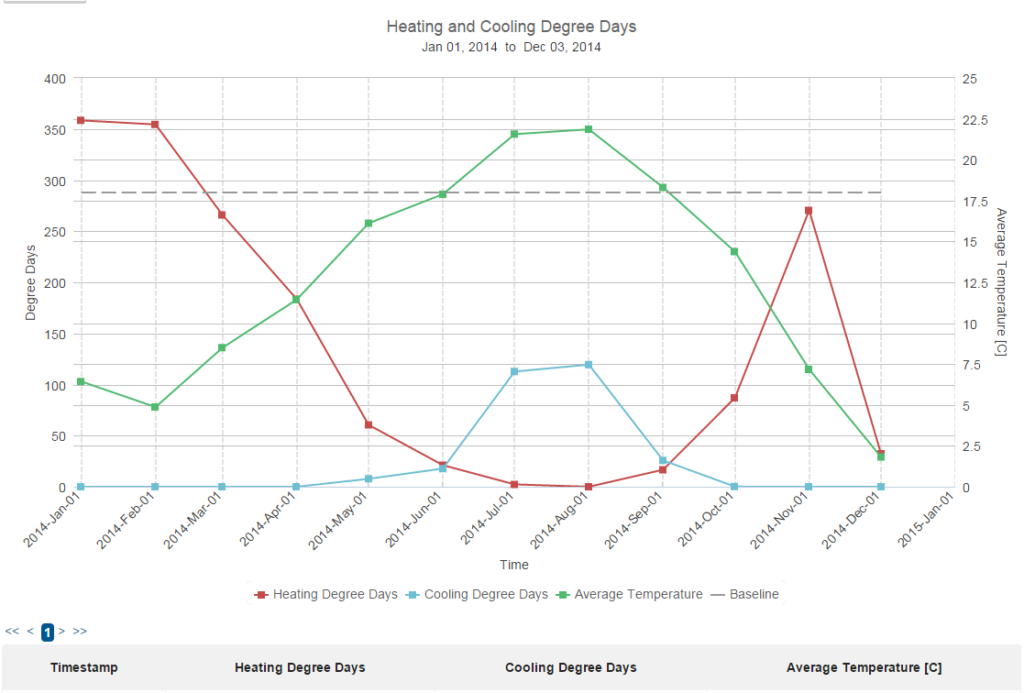
Description: Chart accepts an outdoor air temperature trend log with values in deg C. Calculates and displays heating and cooling degree days based on a baseline temperature of 18 deg C. Table presents a summary for the selected time period.
Example: This chart is used to anticipate your heating or cooling requirements based on the outdoor temperature, giving you further insight into your energy usage.
- Chart type: Line
- Input type:
- No. of Input meters: 0 +OATdegC
- Suitable for: Energy
- Default Units: SI degree days
Outputs: Non-cumulative chart displaying the amount of HDD and CDD.
Special Characteristics: Summary at bottom of the table allows the choice of (sum, average, min, max)
Tags: Temperature, Line, Separate, Absolute, 2-Input