Description
When Kaizen makes a finding in a Building, it brings it to the user’s attention by producing an Insight, which is a package of information that contains a short message and specific details about a finding.
Kaizen determines it has made a finding by running logical rules on a Building’s data. Each Building has a number of logical rules that run by default, and as many customs, logical rules as a user would like to run. You can find more information about Rules and Logic here.
Once triggered by a Rule, an Insight appears in the Insights Log. Here, the user can use a variety of tools to view and manage their building’s Insights.
Insights Management Tool
Kaizen’s new Insight Log is all about turning Insights into Action.
It starts with completely customizable Views that expose the details of Insights that are the most meaningful to you. These Views give you the power to control the grouping and sorting of Insights which makes the prioritization of issues simple and efficient.
CopperTree has also added new features that allow users to triage, assign, and track Insights. Features like Tags and Statuses help organize Insights that have already been investigated or discussed. Now you can assign users to issues and manage your team directly in Kaizen. With Kaizen’s new Insight Management, you can easily follow-up on issues that are recurring and track your resolutions to prevent work from being duplicated.
Views
Views provide unique ways for you to organize and navigate the various Insights in your Building.
Views are comprised of Columns which provide specific details related to Insights. You can leverage these Columns to the group and sort the findings in your Building.
CopperTree provides a number of Views by default, however, you can create custom views to bring forward the information that is most meaningful for you. Click here to learn How-To Create Custom Views
Columns
System: Displays the System associated with a specific Insight/Working Rule. Grouping on this Column will help pin-point pieces of equipment with poor performance.
Rule: The Working Rule that triggers the Insight is displayed in this Column.
Rule Type: Displays the Insight Type that is defined in the Rule. Fault Detection, Energy, KPI, Golden Standard, and Infrastructure are the types.
Priority: The priority defined in the associated Working Rule is displayed in this Column. Priorities are High, Medium, or Low.
Message: Displays the message defined in the associated Working Rule.
Threshold Value: Displays the current Golden Standard value for the BACnet property associated with a Golden Standard Insight.
Latest Value: Displays the new BACnet Property value associated with a Golden Standard or Infrastructure Insight.
Device Address: Displays the associated BACnet Device ID for BACnet Object-based Insights or the Edge device address for Edge Device Insights.
Last Occurrence: The most recent date and time the Insight was Triggered is displayed in this Column.
Current State: Displays the current Insight State. Active indicates the issue is present within the current aggregation period as defined in the rule template. Inactive means the Insight was previously triggered but is no longer triggering.
Active Since: Displays the first date that the Insight started triggering while it is still active.
Kaizen Variables: Use the various Kaizen Variable Columns (Potential Savings, Avoidable Cost, Hours of Faulty Operation, etc.) to display calculated values relevant to the Insight.
Rule Template: The Rule Template associated with the Insight is displayed in this Column. Grouping on this Column will help determine the most common issues across various pieces of equipment.
Assigned To: Displays the Kaizen user assigned to an Insight. Grouping on this Column will help visualize the workload assigned to your team.
Status: The Insight status is displayed in this Column. Options for statuses are Open, In-progress, and Closed.
View: This Column provides a link to quick-view the Insight History heat-map (eye icon ) and a link to the Insight Details (open in the new tab icon). When exporting Insights as a PDF this column provides a link to the Insight Details.
Rule Status: Displays if the Working Rule associated with an Insight is Enabled or Disabled.
Tags: Any Tags users add to an Insight will be displayed in this Column. Tags can help indicate that an Insight has been investigated and allow us to leverage a customizable field to group and sort on.
System Tag: System Tags of the associated System will be displayed in this Column. Grouping on this Column will help show which types of equipment have the most issues.
Activity Type
Rules can be filtered according to their activity type as well. A rule is said to be active if it is at a faulty state as defined by the rule triggering the insight, irrespective of when the insight was triggered.
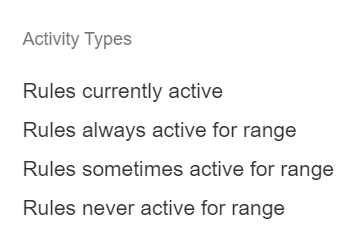
There are four Activity Type Filters:
- Rules currently active: It shows insights from rules that are currently triggered. By default, this refers to the current week.
- Rules always active for range: This shows rules that were active during the entire range selected. Once you click on this option, a range appears on the right of this filter. Click on the button to select the appropriate range.
- Rules sometimes active for range: This shows rules that were active during any time during the range selected. Once you click on this option, a range appears on the right of this filter. Click on the button to select the appropriate range.
- Rules never active for range: This shows rules that were never active during the range selected. Similar to the rules above, once you click on this option, a range appears on the right of this filter and click on the button to select the appropriate range.
Note: If a change if made to the filter, please click on the “Play” button ![]() to run the new filter.
to run the new filter.
Default Views
Default: This view focuses the user on the most critical issues in their building based on Priority ranking. The systems, Potential Cost Savings, and Hours of Faulty Operation are displayed to assist in prioritization. The user can also set ‘Status’, ‘Tag’ and ‘Assigned To’, to further prioritize and organize their Insights.
Default Classic: This view is designed to emulate the legacy Insights Log with columns for Priority or a specific Kaizen Variable, System, Message, Rule Type, Last Occurrence, and Current State. Some classic views filter for only Insights of a specific Priority and others filter for specific Rule Types.
Golden Standard by Rule: This view provides a grouping of Golden Standard Insights by Rule. In the Golden Standard case, the rule is the Object Property that is being tracked using the Golden Standard Configuration for that object or object type. The columns Threshold Value and Latest Value show the Golden Standard differences for the selected rule. Property differences that are too large to render will not be displayed.
Infrastructure by Rule: This view provides a grouping of Infrastructure Insights by Rule. This view is similar to the Golden Standard by Rule view but without the Threshold column. The Latest Value column shows the latest object’s Present Value if applicable.
FDD Insights by Rule Template: The FDD Insight by Template view provides a grouping of Insights by Rule Template sorted by count. This allows the user to see how broad an issue is across their systems.
Insights by System: This view groups Insights by system and sorts them to show the systems with the most Insights first. This allows users to prioritize which systems to work on based on the number of issues that affect them.
Insight Preview
Clicking on the eyeball icon in the “View” column will bring up a preview of the Insight at the top of the page. The preview shows the Insight history as a calendar histogram as well as a list of the Insight’s action history. This helps users to see how active an Insight has been in the past to help them judge how severe the issue is. Also, the action history for the Insight shows whether anyone is working on it or has done something with it in the past. A more detailed view can be seen on the Insight Detail page.
Exporting Insights
The most valuable Insights are the ones that turn into action. That means the discussion that follows is as important as the finding itself.
For this reason, traditional Kaizen Insight Charts and Reports have been replaced with the integrated resource management and issue tracking features of Insight Management. With the new tool you can assign users to issues, leave comments, and update issue statuses as progress are made. In order to make the most of the new tools, be sure to add the “View” column when exporting Insights so that users can get back into Kaizen and continue the discussion easily.
Exporting new Insight Reports is as easy as clicking the “Export” button at the top-right of the Insight Management Log, for more details on exporting Insights click here.
There are 4 formats available for export:
PDF: Creates a PDF with a summary of the Insights enclosed and a table listing all Insights that were captured by the View chosen. You can provide a title and description for the PDF.
CSV: Creates a CSV listing all headers of the Columns from the selected view and displays the “View” Column as the Insight ID.
Excel: Creates an Excel Workbook with all Columns from the selected view and displays the “View” column as the Insight ID.
Report: Creates a PDF compiling multiple default or custom Views into a single deliverable. You can provide a title and description for the PDF
Actions
Insight Management expands on the actions that can be taken with Insights.
Now you can update statuses, leave comments, and assign users to issues. You can also follow up on actions by creating Views that display the assignee, issue status, tags, and more.
The following actions can be taken on an individual Insight, or on groups of Insights:
Promote to Golden Standard: Promotes the current BACnet Property’s value to the new standard – this is only for Golden Standard Insights. This action will overwrite the “Threshold Value”.
Comment: Add a comment or note to the Insight(s). Comments will be time-stamped and the User who wrote the comment will be listed. Comments are not available as a Column, but can be included in the exported report if you click “Include action history”.
Assign: Select a Kaizen user to take responsibility for an Insight or group of Insights. You can also view the assignee of various Insights in the Log using the “Assigned To” Column. A user can only assign insights to another user at the same level on the client tree or lower. If a User at a higher level needs to be assigned an insight, the higher level user needs to be added as a “Consultant User” to the account by following the steps here.
Update Status: Change the Status to show the progress of the Insight(s) so far. Options are Open, Closed, and In-Progress.
Enable/Disable the Rule: Determines if the Working Rule that produced the Insight(s) should be Enabled (running) or Disabled (no longer triggering Insights and calculating CTLs). This enables/disables the Working Rule only, other instances of the same Rule Template will not be affected.
Tag: Assign tags to Insights as a means of organizing and triaging Insights. Any tags assigned will be displayed in the “Tags” Column. Insights can have one or more tags and all tags are customizable. Use insight tagging to identify a set of insights you want to start work on. Create a filter to filter on the tags you added and save it. You can keep coming back to that filter and see the results and see how well your project is progressing.
Insight Details
When investigating an individual Insight, all the essential information related to the finding is organized on the Insight Details page.
The Insight Details page gathers the various Working Rule settings, Insight History, and Action History and displays all relevant Trend Logs with the Insight.
Insight Summary: Working Rule and Rule Template details are listed here. This includes the Inputs, Outputs, Insight Message, and Diagnosis/Recommended Action. Additionally, links to the Working Rules and Rule Templates are displayed here.
Insight History: A heat-map visualizing the active periods of the Insight is displayed in this section. The previous two years’ and the current year’s Insight History will be shown.
Insight Trend Logs: All Input and Output Trend Logs related to the Working Rule/Insight will be plotted here. You can add more Trends to the viewer by clicking “Add Trend Logs”
Additional Properties: Additional Insight information such as Last Occurrence, Priority, System, Rule Type, and Status is displayed in this section.
Action Controls: Click the various buttons to take action on the Insight. Add a comment, assign a user, or update the Insight Status.
Action History: This section will list any comments and actions that were taken for this Insight. You can always see what has been previously worked on with an Insight by checking this section of the Insight Details.
Insights Manage Rules
The Insights Manage Rules page (not to be confused with Systems Manage Rules) is a record of all the Rule Templates that are in a Building. A user accesses a Building’s Insights Manage Rules page by selecting “Manage Rules” in the Insights drop-down.
On the Insights Manage Rules page, a user can search for, filter through, and manage the Rule Templates in their Building, as well as add new Rule Templates to it.
You can find more information about Rules and Logic here.
Rule Templates Information
On the Insights Manage Rules page, there are four columns of information for each Rule Template:
- Name: The name of the Rule Template
- Description: A short explanation of what the Rule checks
- Type: The Type of Insight that Working Rules made from the Rule Template will produce
- Status: Whether the Rule Template will execute its logic. Can be Enabled or Disabled.
Insights Manage Rules Search Field and Filters
As in the Insights Log, the Insight Manage Rules Search Field searches on all the text of each column of Rule Templates information. A user can search for text from multiple columns in the same string to isolate the Rule Templates they need. Next to the Search Field is a dropdown menu, where a user can select the number of Rule Templates displayed per page.
A user can filter the Rule Templates by Typing with the filter buttons above the top left corner of the list of Rule Templates.
Adding New Rule Templates
By clicking on the![]() plus button in the top left corner of the Rule Template list, a user can create, clone, or import a Rule Template to a Building. You can find more detail on adding Rule Templates to a Building here.
plus button in the top left corner of the Rule Template list, a user can create, clone, or import a Rule Template to a Building. You can find more detail on adding Rule Templates to a Building here.
Rule Template Management
The ![]() button displays the amount of Working Rules that belong to a given Rule Template. Clicking takes a user to that Rule Template’s page, where they can edit, export, delete, and enable/disable the Rule Template and its Working Rules. You can find more information on Rule Template Management here.
button displays the amount of Working Rules that belong to a given Rule Template. Clicking takes a user to that Rule Template’s page, where they can edit, export, delete, and enable/disable the Rule Template and its Working Rules. You can find more information on Rule Template Management here.
Golden Standard
The Golden Standard feature monitors the changes in a Building’s controllers and notifies users every time a change that is of interest happens inside them.
When a CopperCube is deployed in a Building, it takes a snapshot of all the Building’s controllers, within the user set Device Range. This snapshot becomes the Building’s, Golden Standard. Any deviation from this standard is reported as a Golden Standard Insight.
Before a user edits a Building’s Golden Standard configuration, their Building will have the default configuration as designed by CopperTree Analytics. Only certain properties of each Object Type are commonly considered noteworthy.
A user can edit a Building’s Golden Standard configuration on the Manage Golden Standards page to monitor any property in which they are interested. The Manage Golden Standards page can be reached by navigating to the ![]() Insights and clicking the scales of justice.
Insights and clicking the scales of justice.
Here is a list of every Object property monitored by the Golden Standard feature.
Manage Golden Standard
A user can edit Golden Standard configurations for entire Object Types or by individual Objects.
The most common BACnet Object Types are laid out in a grid in the Configure Object Type window. Those that users have edited away from the default appear in gold.Individual Objects that have had their Golden Standard configurations edited away from the default compile a list in the Configure Object window. The window has columns for Object Name and Reference ID. A user can sort by these fields, as well as search on any text they contain.
You can find more information on the Golden Standard configuration here.
List of enabled properties
Show list of enabled variables…
Type
There are six different Types used to categorize Insights. Two of the Types are for rules that monitor Objects and the other four Types are for rules that analyze Trend Logs.
| Type | Setup | Based on | Focus | Example |
|---|---|---|---|---|
| Infrastructure | Enabled by default | BACnet objects | Issue, fault, or event in a building related to its control system operation or data collection infrastructure. | Device clocks not synchronized |
| Golden Standard | Enabled by default | BACnet objects | Deviation from the building controls parameters (operational snapshot) | Device Name changed |
| Fault Detection | By user with Logic Rules | Trend Logs | Issue, fault, or event in a building from the ‘Equipment Operation’ perspective. | VAV3 Damper is not modulating |
| Integrity KPI | By user with Logic Rules | Trend Logs | Performance issue from the ‘Operational Performance’ perspective. | Boiler Hot Water Supply Temperature is outside of an acceptable range of its set point for more than 2.5 hours per week. |
| Energy | By user with Logic Rules | Trend Logs | Issue, fault, or event in a building from the ‘Energy’ perspective. | VAV Motor is Over Average Current from Last year |
| Energy KPI | By user with Logic Rules | Trend Logs | Performance issue in a building from the ‘Energy’ perspective. | Boiler energy consumption is higher than the hourly target for more than 25% during 10 hours per week |
Object-Based Insights
The two Types of Insights for Object-based are Infrastructure and Golden Standard.
Golden Standard Insights indicate a change in one or more properties of interest in one of a Building’s controllers.
The Golden Standard feature is described in more detail above. You can find more information on the Golden Standard configuration here.
Infrastructure Type Insights indicate findings in a Building related to its control system operation or data collection infrastructure. They are automatically set up for every Building.
You can find detailed information on each variety of Infrastructure Type Insight in the list below.
Show list of Infrastructure Insights…
Trend Log Based Insights
The four Types of Insights for Trend Log analysis are Fault Detection, Integrity, Integrity KPI, and Energy KPI. A user can select between these four Types when setting up a Rule Template in their Building.
You can find more information on setting up Rule Templates here.
Kaizen Variables and Enhanced Prioritization
There are a number of ways to evaluate the importance of Insights as compared to each other. Default Priority, Potential Savings, Impacts, and Urgency Scores allow a user to rank their Insights and determine which of them to address first. The use of Potential Savings, Impact Scores, and Urgency Scores is called Enhanced Prioritization. The values themselves are referred to as Kaizen Variables. Kaizen Variables are assigned to CTL data in the Logic Builder. You can find more information on how to set up Kaizen Variables here.
Default Priority
Each Insight has a Default Priority of Low, Medium, or High. A user sets the Default Priority of an Insight in the Rule Template of the Working Rule that produces it. This property is displayed on the left of the Insights Log, and the Building Dashboard has a widget that displays the number of Insights of each Default Priority in a Building.
Potential Savings
Potential Savings is a Kaizen Variable that is a measure of how much money could be saved a year if a particular Insight were taken care of. Typically, it is calculated with electrical billing information, and consumption or demand data. A user can use the Logic Builder to calculate a value of dollars/year and output that value as a Kaizen Variable. The Potential Savings widget on the Dashboard displays the total of all the Potential Savings in a Building, as well as the top five individual Potential Savings values below that.
Realized Savings
Realized Savings is a Kaizen Variable that is intended for measurement and verification (M&V) use. This is a metric that illustrates the savings of a particular measure implemented in the Building from the date it was implemented until now. In the Logic Builder, the CTL that defines this Kaizen Variable should be Accumulating.
Avoidable Cost
Avoidable Cost is intended to show the cost that a particular fault has accrued to date. Where Potential Savings is a projection, Avoidable Cost is a measure of what has already occurred. Typically, Avoidable Cost is calculated as a cumulative sum.
Hours of Faulty Operation
This Kaizen Variable represents the duration of a particular fault in hours. Hours of Faulty Operation can be calculated week over week for use in KPI Reports, or, as a cumulative sum to represent the duration of the fault to date.
Impact Scores
Impact Scores are Kaizen Variables that are measures of duration. They indicate the percentage of time in an interval that some type of performance was negatively affected. A higher score means a larger negative impact. There are eight different Kaizen Variables:
- Comfort Impact
- Cooling Impact
- Energy Impact
- Environmental Impact
- Heating Impact
- Property Impact
- Safety Impact
- Ventilation Impact
A user can use the Logic Builder to assign a value of zero or 100 to a CTL, depending on a good or bad performance, respectively. At the end of a week, all of the samples of interest are averaged to arrive at an Impact Score.
Urgency Score
An Urgency Score is a Kaizen Variable that is a rating of how urgently a hazardous situation must be dealt with. It is calculated similarly to Impact Scores but generally focuses on the magnitude of faults. An Urgency Score of zero means that there is no threat to people or equipment in the building, and a Score of 100 means that there is an imminent threat to people or equipment in the building.
Kaizen Insight Integration
Insights from Kaizen can be exported and integrated using API calls. For more information, click here.
