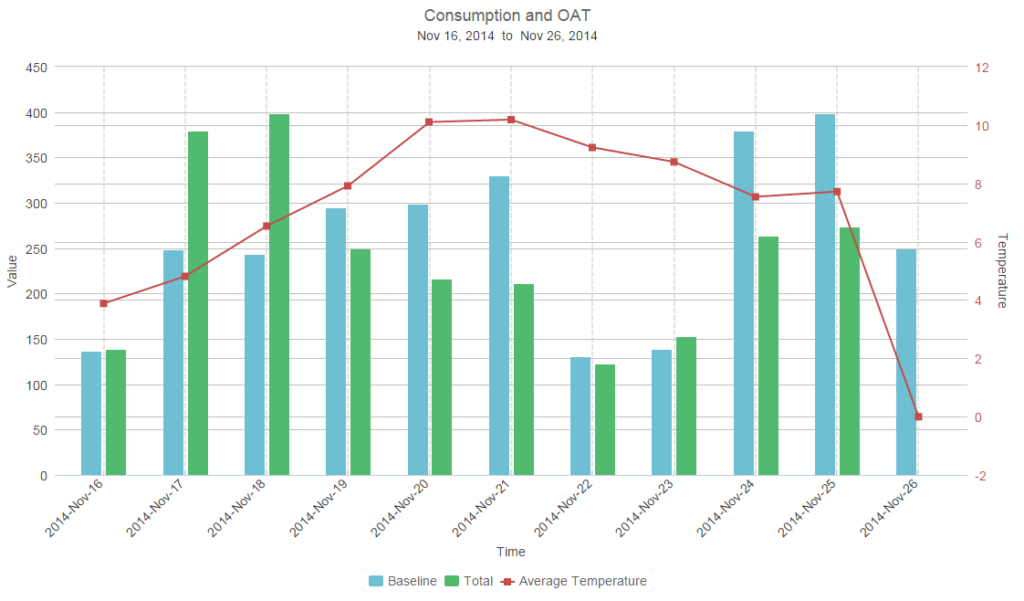
Description: Accepts 3 Inputs: 1 cumulative TL, 1 temperature TL, and 1 demand TL. The difference between subsequent data points is calculated for the cumulative meter, then summed over a requested interval. It is then displayed as a bar chart, alongside a 1-week offset, which acts as a baseline. The temperature meter is averaged over request period, and plotted as a line onto the bar graph. The minimum and maximum energy demand is shown as part of the table below.
Example: This chart is used to compare the current energy with previous energy usage, against a temperature line over a user selected time range. More specifically, if a week time range was selected, the current weeks energy usage would be compared against the previous weeks usage on a daily basis(default aggregation interval). This chart is useful to see if you are using more or less energy than before and how the temperature is affecting the energy usage.
- Chart type: Column
- Input type: Cumulative, Temperature, Demand
- No. of Input meters: 1
- Table Summary: None
- Suitable for: Energy
- Default Units: kWh
Aggregation Type:
- Consumption: Sum
- Demand: Min/Max
- Temperature: Average
Outputs: Delta, Sum of Period
Special Characteristics: Demand appears only in the table
Tags: Consumption, Comparison, Separate, Absolute, Meter, Temperature, Bar, Line, Baseline, 3-Input