Description: Accepts 1-10 Trend Logs as input along with user configuration to produce a user-customized chart. The chart is limited to a single graph and a single table. This chart performs a delta operation, filters negative values, and then does a sum aggregation on the data series; which is ideal for cumulative inputs.
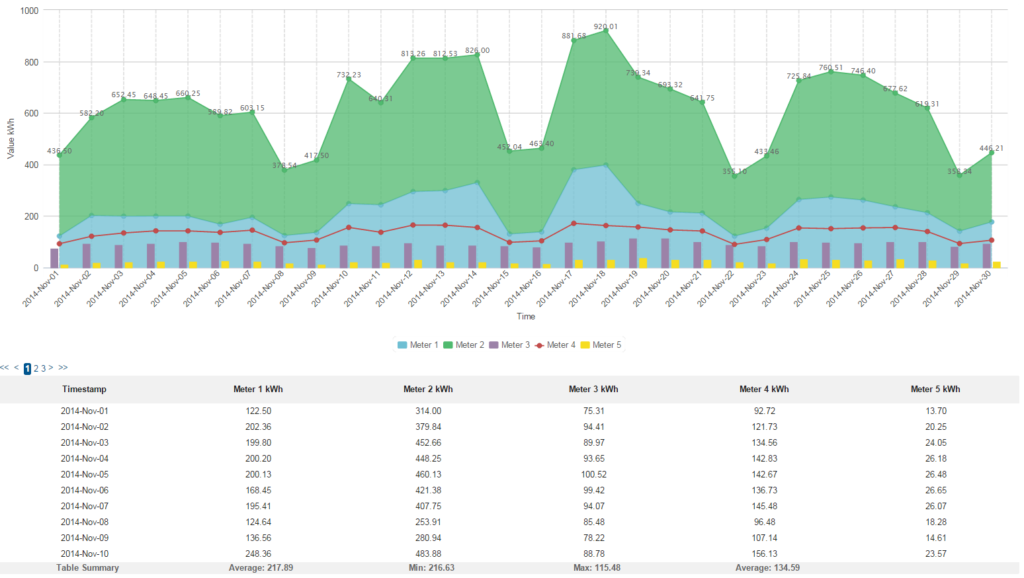
Example: 5 data sets are used – 2 areas, 2 columns, and 1 line. All series are on the primary axis. The Series Table Summary is set to average, min, max, average, and no aggregate for series 1-5 respectively.
- Chart type: Column, Stacked Column, Area, Line, Scatter
- Input type: Cumulative
- No. of Input meters: 1-10
- Aggregation Type: Sum
- Table Summary: No Aggregate, Median, Distinct Count, Sum, Min, Max, Count, Average, StDev, Mode
- Suitable for: Energy, FDD, Integrity
- Default Units: kWh
Outputs: A chart displaying a total of 1-10 non-cumulative data series of any or a combination of the chart types described above.
Special Characteristics: This chart is a customizable chart that requires the user’s input to function.
Required Inputs:
- Chart Name: Name of the chart instance.
- Series #: Name of the series referenced in the chart.
- Series # Type: Series type indicates how the series is represented on the chart. Options are column, stacked, scatter, area, and line.
- Series # Y Axis: Indicates to which of the 2 axes the series is aligned to.
- Series # Input: Indicates the Trend Log that is represented by the series.
- Series # Color: Indicates the color that represents the series.
- Series # Table Summary: Indicates the data series summary in the summary row.
Optional Inputs:
- Default date range: The default date range of the data when the chart is first opened.
- Graph Title: The name that appears as the graph’s header.
- Line Style: The line styling applied to the Line and Area series.
- Line Width: The width of the line styling applied to the Line and Area series.
- Marker Type: The marker styling applied to the Line, Area, and Scatter series.
- Marker Radius: The radius of the marker styling applied to the Line, Area, and Scatter series.
- Decimal: Indicates the number of digits that appear to the right of the decimal.
- X-Axis Title: The name of the x-axis.
- Primary Y-Axis Title: The name of the y-axis on the left.
- Primary Units: The units associated with the y-axis on the left.
- Secondary Y-Axis Title: The name of the y-axis on the right.
- Secondary Units: The units associated with the y-axis on the right.
- Date Format: Indicates the date format of the displayed timestamps.
- Show Stacked Total: Indicates whether the stacked series total should be displayed on the chart.
Tags: Consumption, Comparison, Separate, Multiple Input, Multiple Type