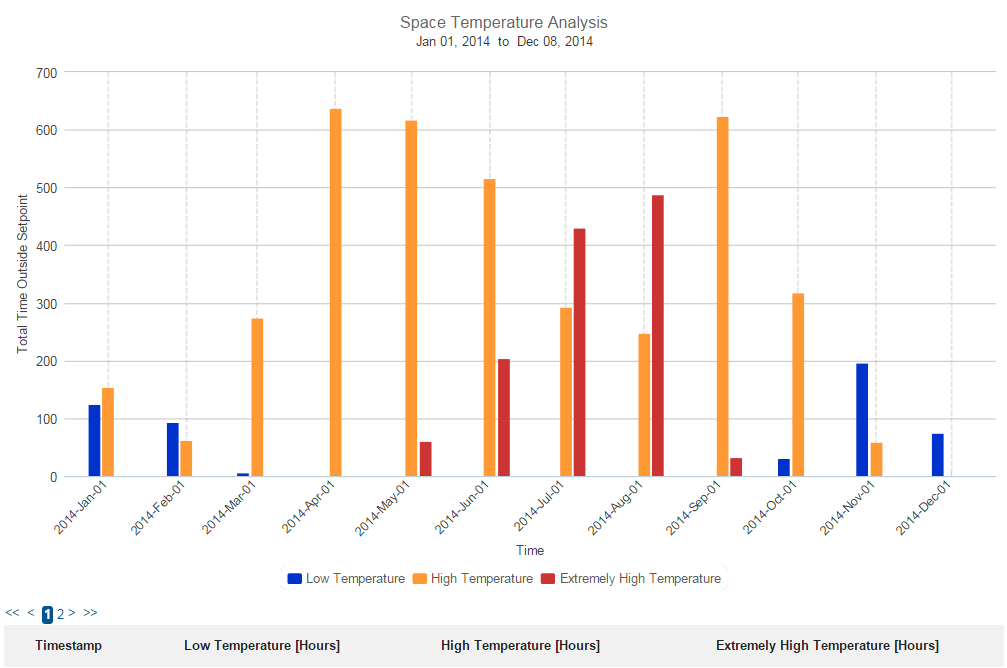
Description: Chart accumulates and displays the number of hours a selected temperature reading is below 20C (low temperature), above 22C (high temperature), and above 24C (extremely high temperature).
Example: This chart is used to determine the number of hours each aggregation interval experiences different types of temperature, which in turn can help determine the effectiveness of the HVAC systems in the building.
- Chart type: Custom
- Input type: Non-Cumulative, Temperature
- No. of Input meters: 0 + temperature
- Aggregation Type: 15 min Linear Normalization
- Summary Type: No Summary
- Suitable for: Energy, FDD, Integrity
Default Units: Hours
Outputs: 3 bar chart, with the number of hours room, is below 20C in the first column, the number of hours above 22C in the second column, and the number of hours above 24C in the third column.
Special Characteristics: None
Tags: Comparison, Absolute, Bar, Bin, Temperature, 1-Input