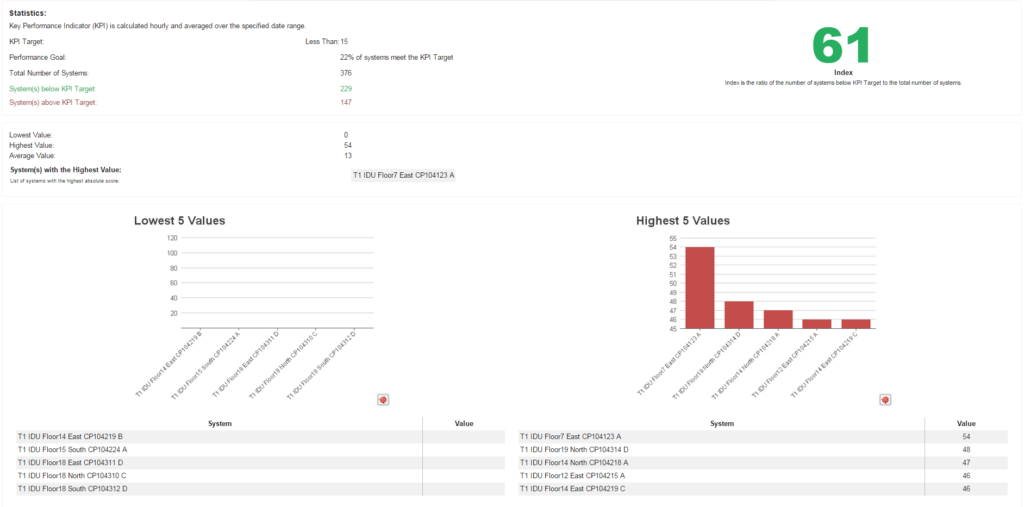
Description: The Threshold Executive chart gives you an executive-level overview of all the Key Performance Indicators within your building, where the aim of the KPI is to be below the chart’s target threshold. That is, system KPIs below the KPI target is performing well. If all the systems in your building can meet the Performance Goal, they are performing to satisfaction.
Example: A good example for this chart is system temperature KPIs, where a KPI will grow if the temperature is outside of the set point. In this case, a low KPI score is preferential, and can easily be tracked by using the Threshold Executive chart.
- Chart type: Summary Table
- Input type: KPI
- No. of Input meters: NA
- Suitable for: KPI
- Default Units: NA
Outputs: Number of systems performing above threshold, number of systems performing below threshold, overall system score, list of highest KPI scores
Special Characteristics: Both KPI Target’s and Performance Goal’s values are set by the user
Tags: KPI, Executive, List, FDD