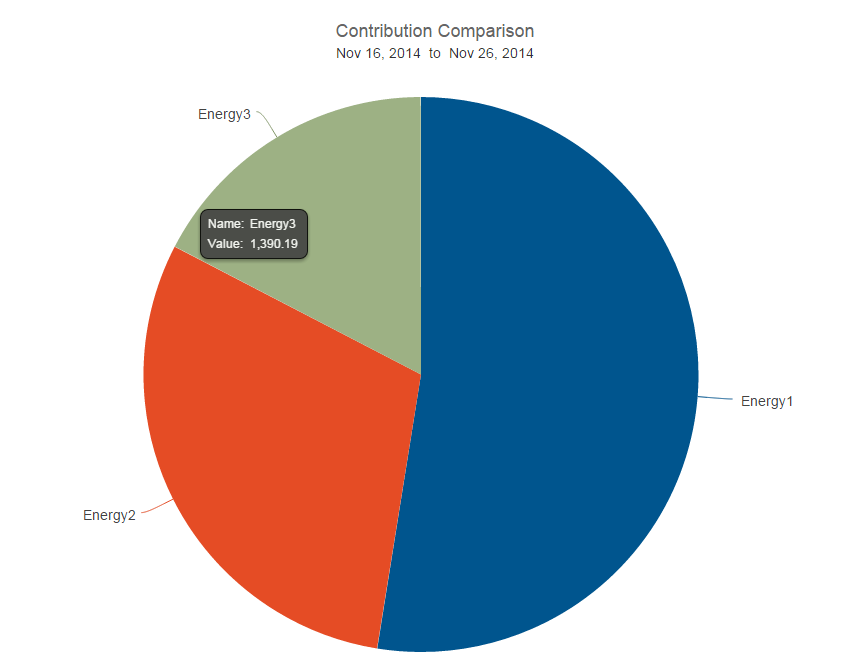
Description: Accepts 3 cumulative TLs as input. Sums the consumption over requested intervals and plots the relative contribution of each consumption in a pie chart.
Example: This chart template is used to compare the relative consumption of three individual meters over a user-selectable range. The three inputs are graphed as a pie chart.
- Chart type: Pie
- Input type: Cumulative
- No. of Input meters: 3
- Suitable for: Energy
- Default Units: kWh
Outputs: Delta, Sum of Period, Contribution over Period
Special Characteristics: None