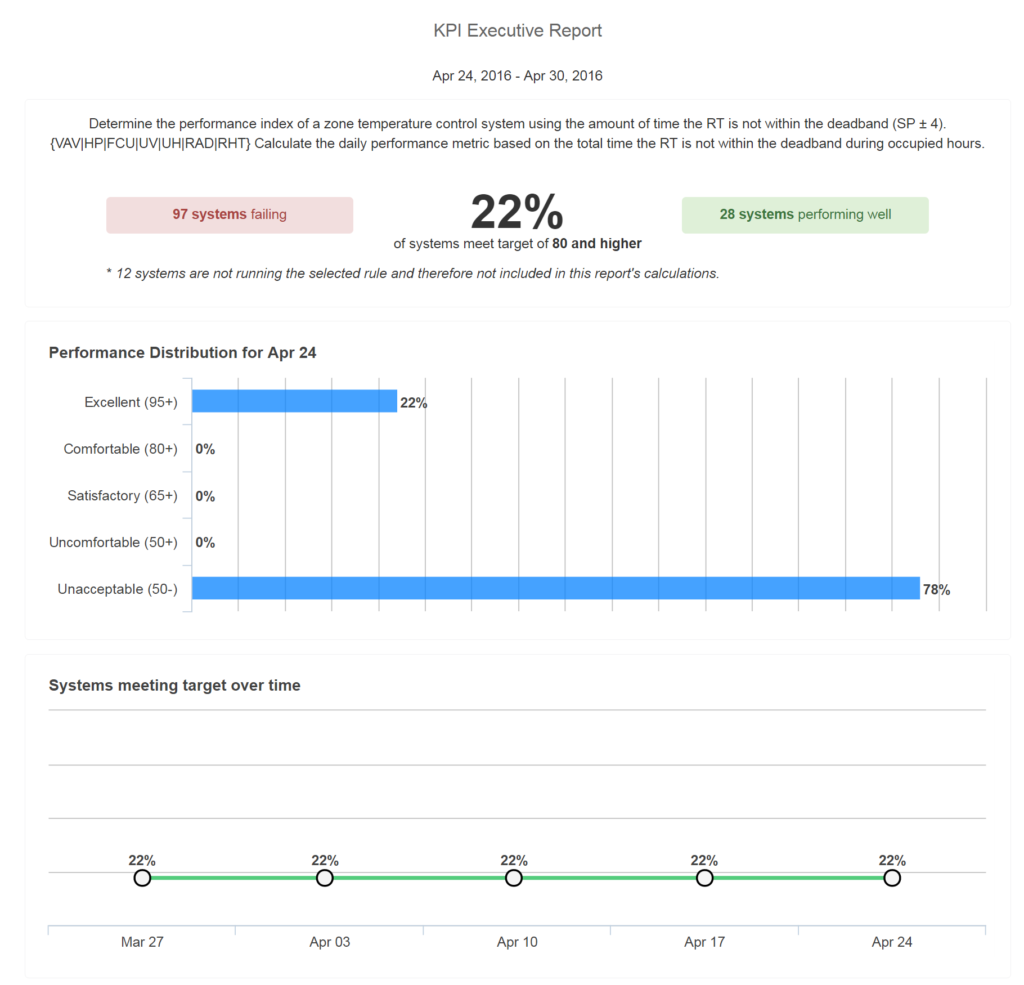
Description: The KPI Executive chart gives you an executive-level overview of all the Key Performance Indicators within your building, where the aim of the KPI to exceed the performance goal. If all the systems in your building can meet the Performance Goal, they are performing to satisfaction. This includes a histogram of the current indicator and the overall trend over past time periods.
Example: A system’s ability to meet the temperature set point is graded on a scale from 0-100. This chart can summarize the performance characteristics of every AHU in a building, by taking these scores and displaying them in an easy-to-understand fashion.
- Chart type: Summary Table
- Input type: KPI
- No. of Input meters: NA
- Suitable for: KPI
- Default Units: NA
Outputs: Number of systems above and below goal, histogram of current values, the overall trend
Special Characteristics: Both KPI Target’s and Performance Goal’s value is set by the user
Tags: KPI, Executive, List, FDD

