Description
The building dashboards cover the whole building; System Dashboards zoom into one part of it. Each works like a small version of Kaizen scoped to that System, with its own Working Rules, Insights, filtered Vault and notes. There are two types:
- Individual System Dashboard – one piece of equipment, such as a single compartment unit.
- Containerized Dashboard – a group of Systems, used to compare KPIs and Insights across every System in the group.
Open the Systems View
There are two ways to reach the Systems tree. Both land in the same place.
- From the Clients & Buildings menu – open the menu in the top-left corner, expand the building, and click its Systems View link.
- From the Systems tab – within a building, click the Systems [icon] tab, then click the eye [icon] beside a System.
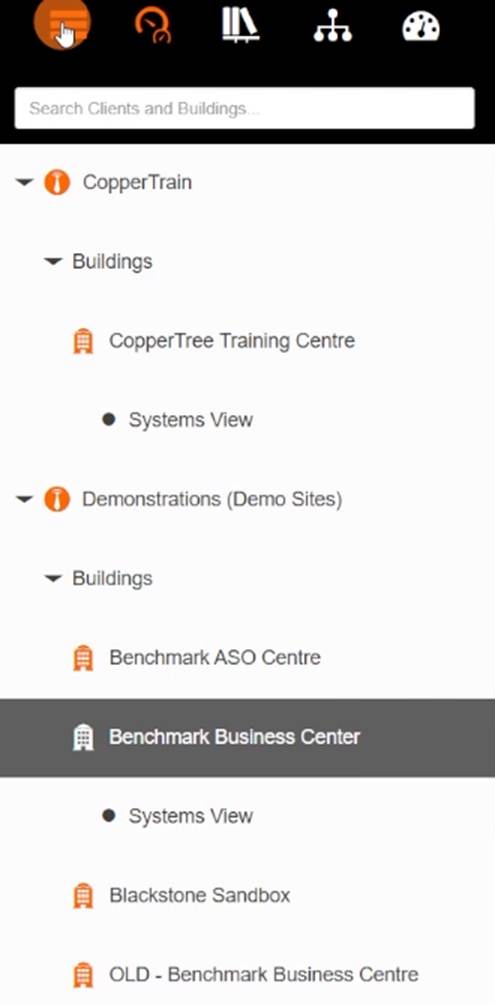
Opening the Systems View from the Clients & Buildings menu
Browse the Systems Tree
The tree on the left lists every System in the building, usually grouped the way the implementation was set up, for example all air handling units together.
- The number beside a group is its count of subordinate Systems. “Boilers (6)” contains six individual boiler Systems.
- Click an individual System to open its dashboard, or a group to open the containerized dashboard.
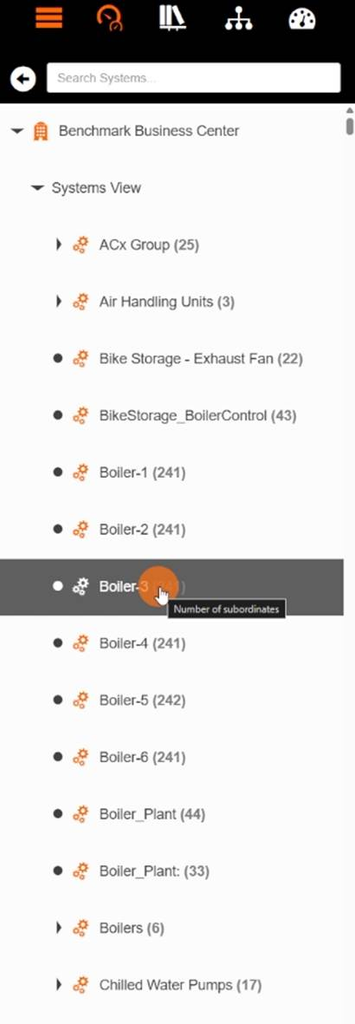
Systems tree
Use an Individual System Dashboard
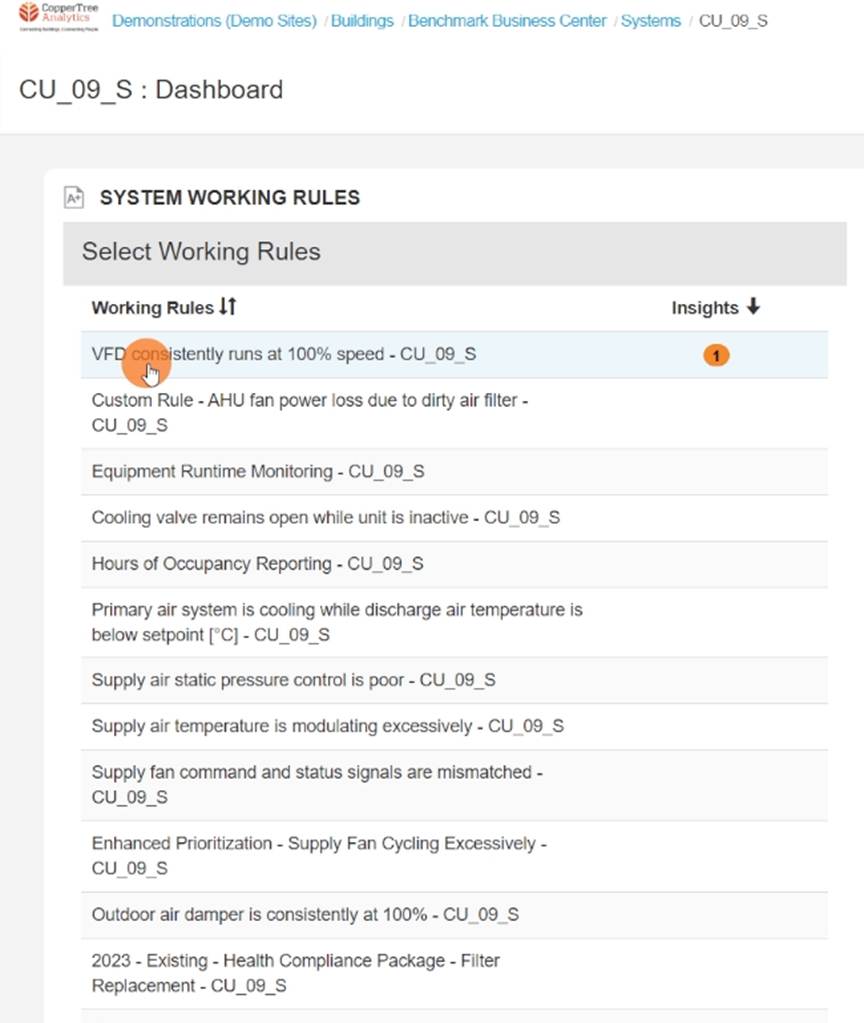
The dashboard lists the System’s Working Rules, sorted with active Insights at the top.
- Click a rule that has an Insight. The Trend Log Viewer loads on the right with the rule’s inputs and outputs, the same view as the Insight Details page.
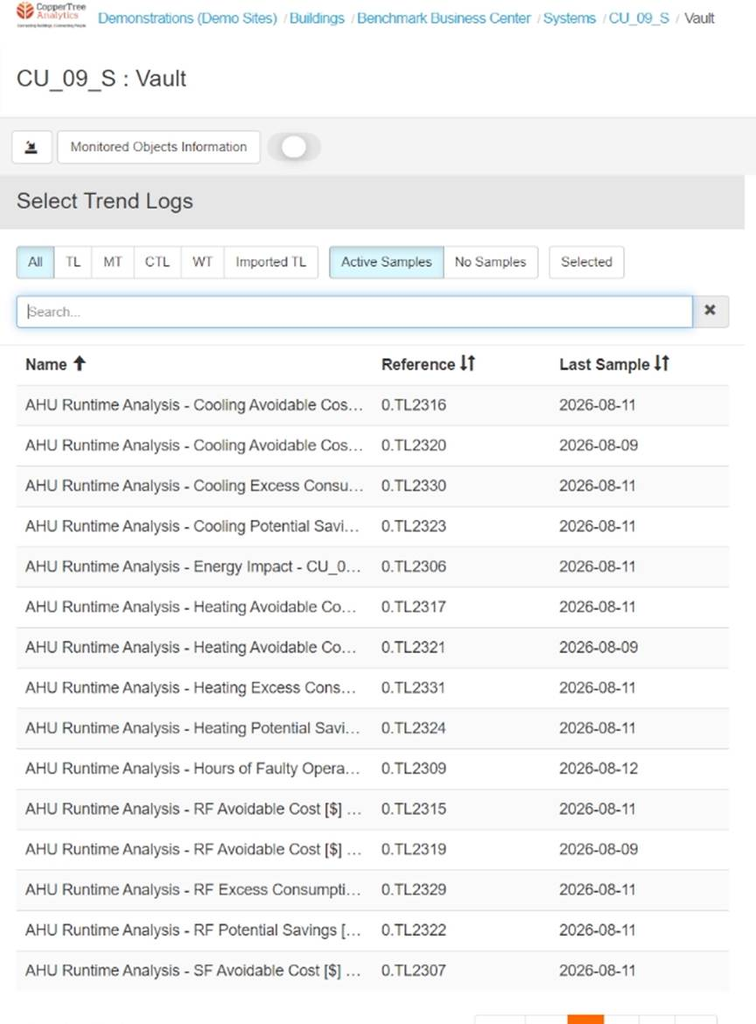
- Click Vault to open the Trend Log Viewer filtered to this System’s trend logs. You can select trends, zoom, pan and export to CSV as in the building-wide viewer.
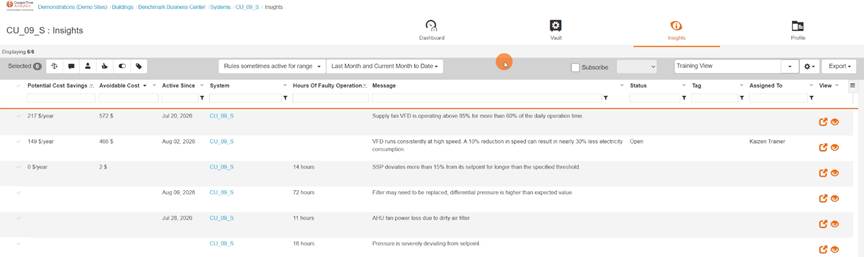
- Click Insights to open Insight Management filtered to this System. Sort, filter and change the date range as usual.
- Click Profile to view or leave notes on the System.
Use a Containerized Dashboard
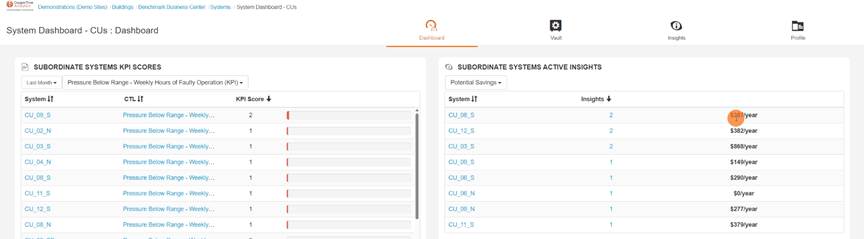
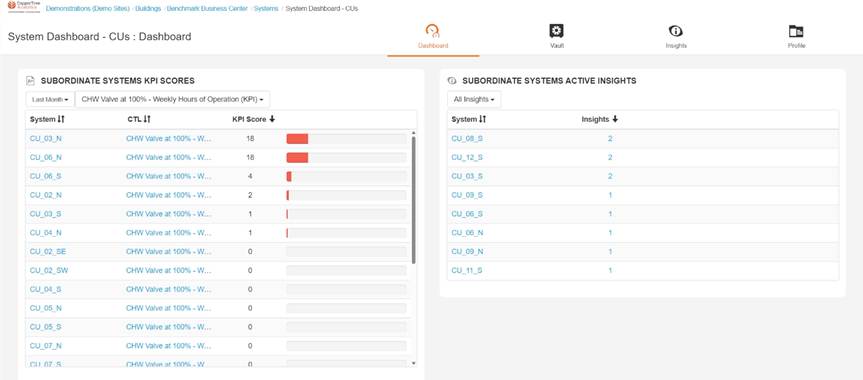
Open a group System, for example “System Dashboard – CUs”, which contains every compartment unit. The dashboard has two widgets.
| Widget | What it shows | Controls |
| Subordinate Systems KPI Scores | Each subordinate System’s score for one KPI, with its Calculated Trend Log, sorted by score | Date range (e.g. Last Month); KPI drop-down (e.g. CHW Valve at 100% – Weekly Hours of Operation) |
| Subordinate Systems Active Insights | Each subordinate System’s active Insight count | Drop-down to add a Kaizen variable column such as Potential Savings ($/year) |
Filter to the Variable You Care About
- Switch the KPI drop-down above Subordinate Systems KPI Scores to another metric, such as hours of insufficient cooling or static pressure deviation.
- In Subordinate Systems Active Insights, choose Potential Savings to see the dollar value next to each System’s Insight count.
- Sort either table to find your worst performers, with no report needed.