
Description
When a Working Rule detects a fault, Kaizen creates an Insight. This article walks through
investigating an Insight from the Insight Management page, confirming the cause in the
trend data, and recording what was done using comments, assignments and statuses.
Open an Insight
From the Building Dashboard:
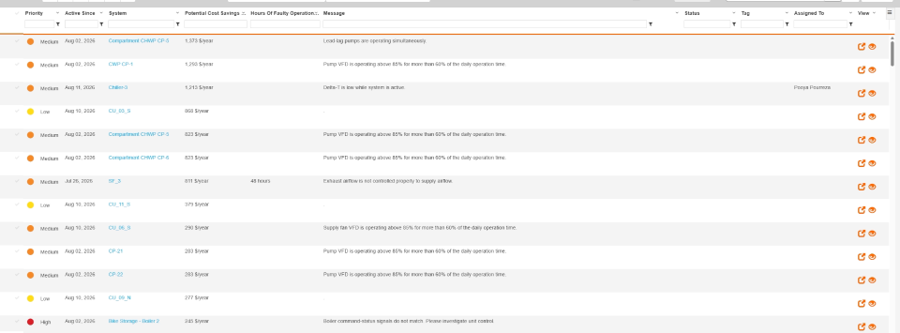
- Click the Insights tab to open Insight Management.
- Sort by the column that matters most to you, for example Potential Savings.
- Pick the Insight to investigate, for example a VFD that is consistently running at high speed.
- Click the open icon on the far right of its row. The Insight Details page opens in a new tab.
Read the Summary and History
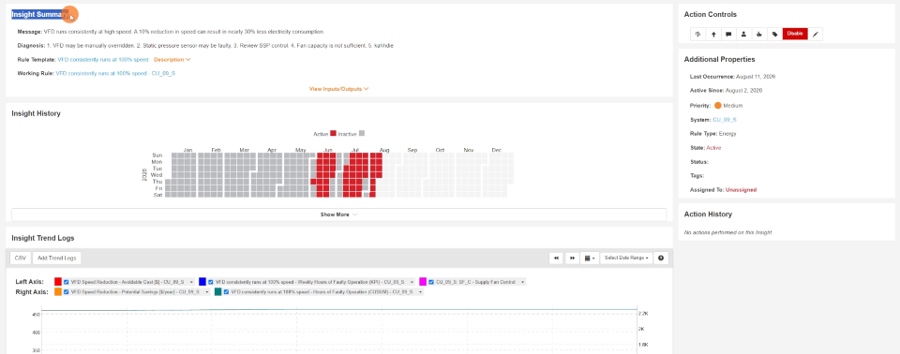
- Check the Insight Summary. It shows the default message, possible diagnoses, and links to the Rule Template and Working Rule behind the Insight.
- Click View Inputs/Outputs to see every variable the rule uses, down to the exact point and its ID.
- Review the Insight History calendar to see when the Insight has occurred this year. Click Show More to go back up to three years.
Isolate a Trend
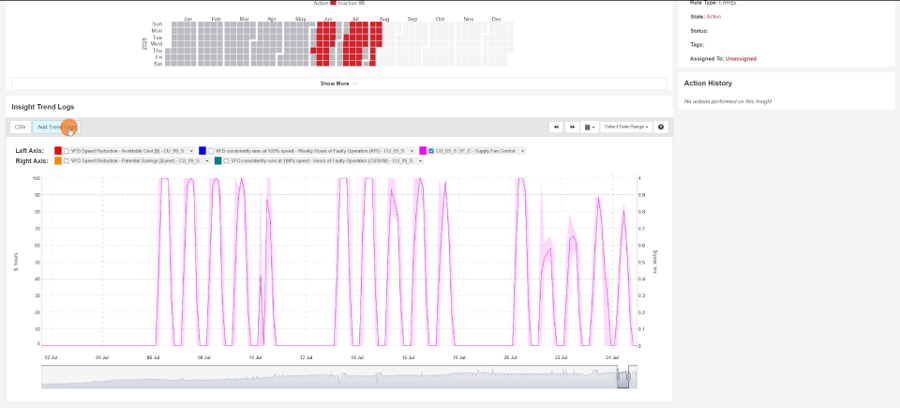
- Scroll to Insight Trend Logs. Every input and output of the rule is plotted by default.
- Click the drop-down beside a trend and select Hide others to show only that trend.
- Adjust the date range if needed. It defaults to last week; use the date selectors or the handles below the chart to see more history.
Add Related Trends to Compare
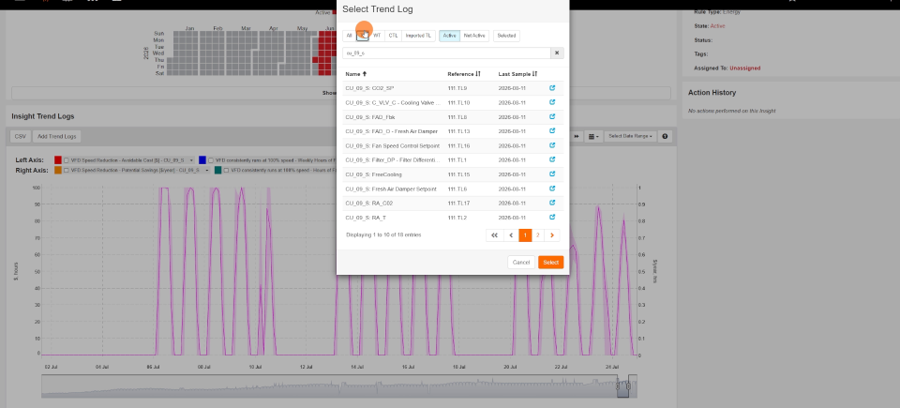
- Click Add Trend Logs. The Select Trend Log dialog opens without leaving the Insight.
- Search for the system and filter by type. For example, select TL to show only trend logs from the BAS and skip Kaizen’s calculated values.
- Select the trends to compare and click Select. They overlay on the chart automatically.
- If the scales don’t match, use the trend’s drop-down to move it to the other axis.
Zoom In to Diagnose the Pattern
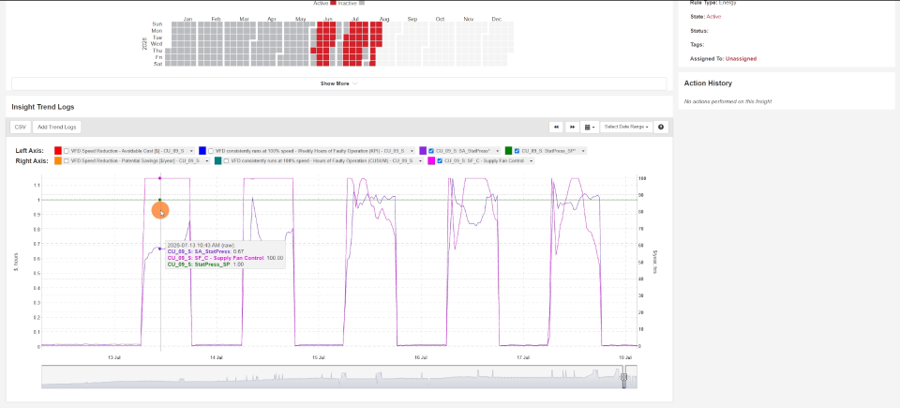
- Hide any trend that clutters the view. For example, hide fan speed to see static pressure against its setpoint more clearly.
- Click and drag across the chart to zoom into the days in question, and line up cause and effect at the hour level.
- Hover over the chart to read exact values and confirm your theory.
Manage the Insight
The Action Controls at the top right of the Insight Details page let you add a comment, assign the Insight, update its status, or apply a tag. Each action is recorded in the Action History.
- To assign the Insight, click Assign, pick a user, add a comment and click Submit. The assignment and comment appear together in the Action History.
- To update the status, click Update Status and select Open, In Progress or Closed.
- To tag the Insight, click Tag and select or type a tag.
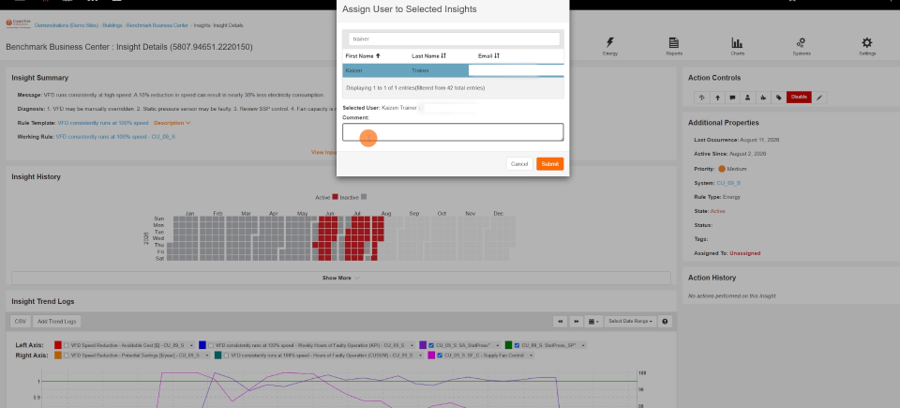
Please note: you can only assign Insights to users at your level or lower in the Client Tree. To assign to someone outside your Client, first add them as a Consultant User.
Manage Insights in Bulk
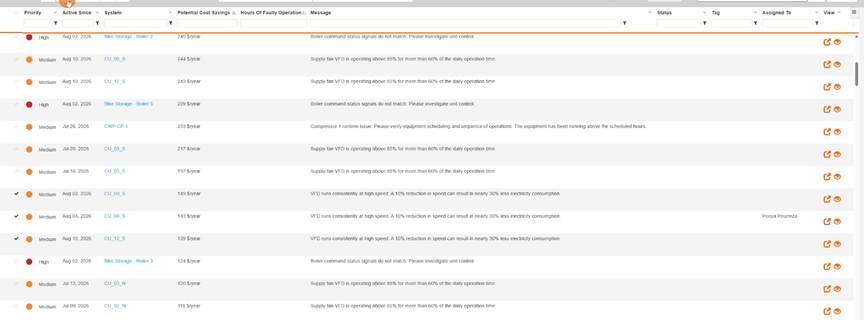
- On the Insight Management list, check the boxes beside several Insights.
- Use the action icons above the table to comment, assign, update status or tag. The action applies to every selected Insight.
This saves time when the same issue appears across many similar systems.
Manage Insights in Bulk
- On the Insight Management list, check the boxes beside several Insights.
- Use the action icons above the table to comment, assign, update status or tag. The action applies to every selected Insight.
This saves time when the same issue appears across many similar systems.
Bulk actions in Insight Management
