
Description
A KPI report compares performance across similar Systems, such as every VAV in a building, and can be emailed on a schedule. You set it up as a working chart on the Charts page, then publish it as a report.
Choose a KPI Report Type
| Template | Best for |
| KPI – Poor Performance Digest | A flat list of every System of a given type with its KPI score, ordered worst to best. Good for side-by-side comparison. |
| KPI Executive Report | Buckets Systems into performance tiers and tracks how many meet target over the last several periods. |
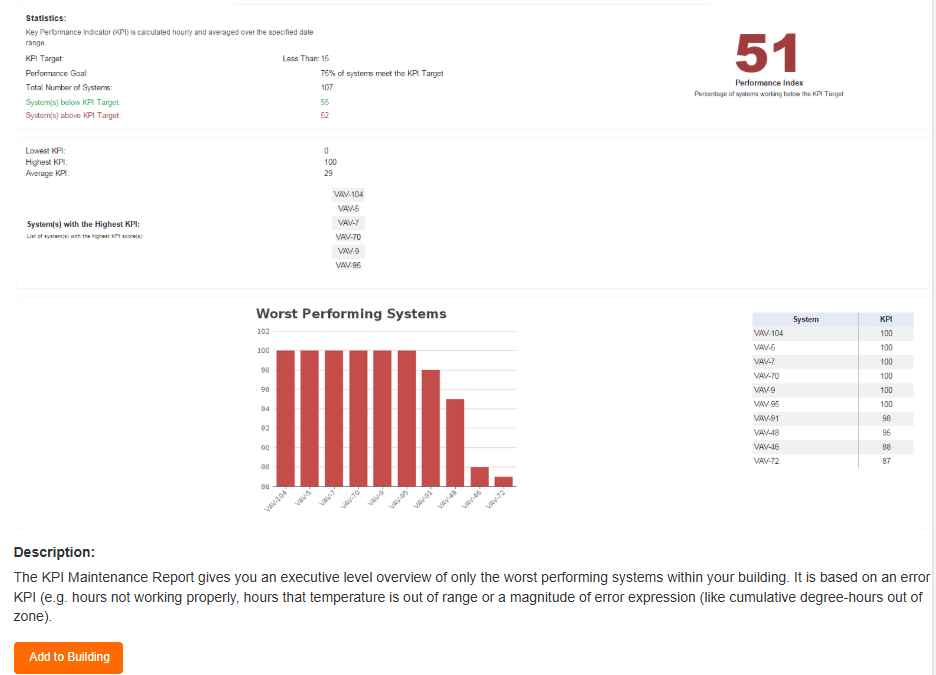
| KPI Maintenance Report / KPI Threshold Report | Shows only your top or bottom N Systems. Best for focusing maintenance effort. |
Add a Chart Template
From the Building Dashboard:
- Click the Charts tab.
- If the KPI report template is not listed, click + to add one.
- Pick the report type that fits your goal. Each template’s description explains what it is for.
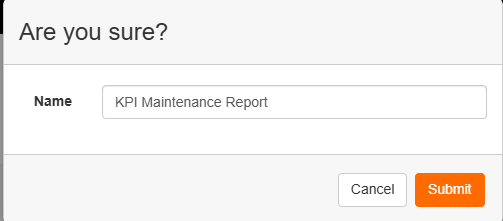
- Add it to your building and give it a name.
Start a Working Chart
- Click Add Working Chart on the template’s row.
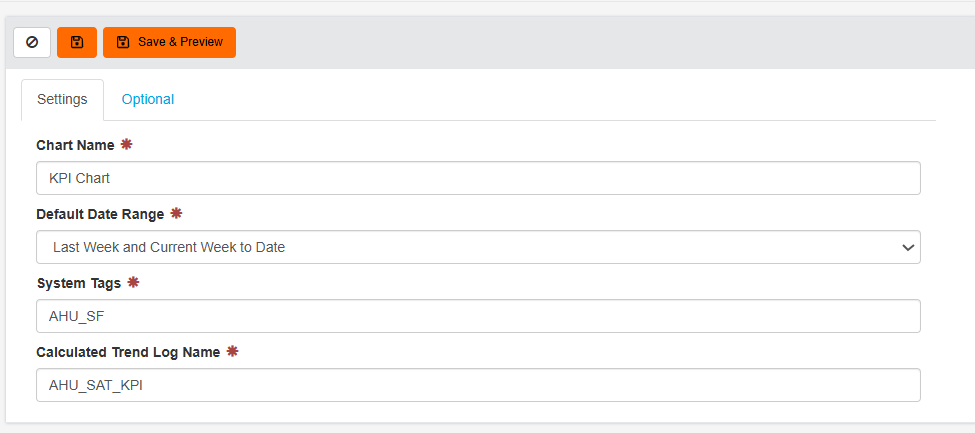
- Enter a name, for example “VAV Airflow Analysis KPI Report”.
- Set the default date range. Most KPI scores are weekly, so a single week is often simplest, but every report also works over longer ranges.
Target the Right Systems
- In the System Tags field, enter the tag that covers the Systems to include. For example, tag every VAV to compare all of them at once.
- To narrow the report, combine tags, such as a system type plus a floor (“Variable Air Volume Box” and “Floor 8”).
- If unsure, check a System’s tags on the Systems page first.
Point the Chart at the KPI Trend Log
- Open one of the target Systems and browse its trend log list.
- Find the trend ending in “(KPI)”, for example “Supply Airflow Out Of Range – Weekly Hours of Faulty Operation (KPI)”.
- Copy the exact trend log name and paste it into the Calculated Trend Log Name field on the chart’s Settings tab.
Fine-Tune on the Optional Tab
| Field | What to enter |
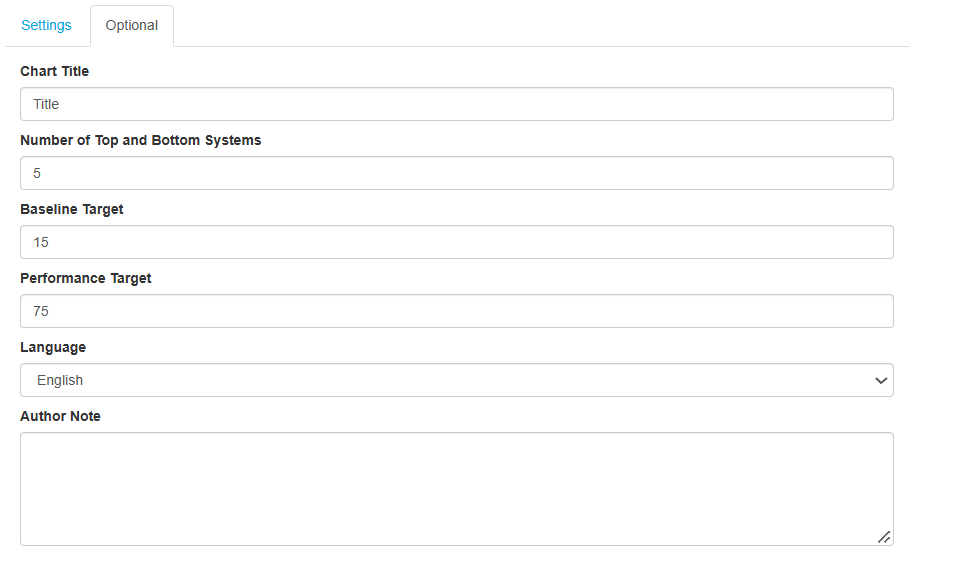
| Chart Title | Title shown on the report |
| Number of Top and Bottom Systems | How many Systems to show, e.g. 5, 10 or 15 |
| Baseline Target | The KPI value you consider acceptable |
| Performance Target | The percentage of Systems you expect to meet the baseline, e.g. 75 |
| Language | Report language |
| Author Note | A short line on what the report looks at. It appears at the top every time the report runs. |
Save and Preview
- Click Save & Preview. A live preview loads on the right.
- Check the performance index. Green means you are above your performance goal. Review the breakdown of Systems above and below target.
- Adjust the system count or targets if needed. For example, raise the baseline target to highlight your worst performers more sharply.
Turn It into a Scheduled Report
The Charts page is for setup; publishing happens here.
- Open your chart and click Create Report.
- Add logos and set the report’s date range. A longer range, such as a month, averages the weekly scores.
- Set the email schedule: daily, weekly or monthly, with the time and day it goes out to subscribers.
- Save the report.
To choose who receives it, see Subscribe to Reports in Manage Reports.
