
Description
The Multipurpose chart builds a custom chart and summary table from up to 20 trend logs, which you can then send as a scheduled report. Along with KPI reports, it is the report type you will see most in buildings CopperTree has implemented.
| Version | What it does | Use for |
| Cumulative | Converts an accumulating trend into interval values, e.g. daily consumption from a running meter total | Energy meters |
| Non-Cumulative | Displays the data as it comes in, with no extra processing | Temperatures and other instantaneous values |
Add the Chart Template
From the Building Dashboard:
- Click the Charts tab.
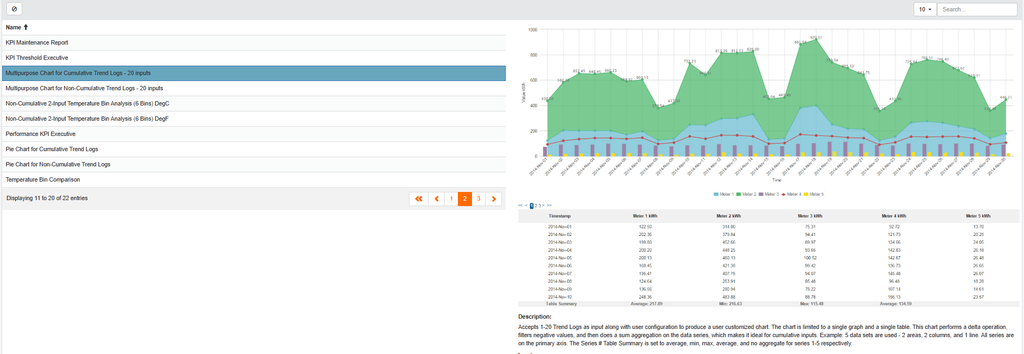
- If the Multipurpose template is not listed, click + and go to page two of the template list.
- Select Multipurpose Chart for Cumulative Trend Logs or the non-cumulative version.
- Add it to your building and give it a name. If that name already exists, add a distinguishing letter or note.
Start a Working Chart
- Click Add Working Chart on the template’s row.
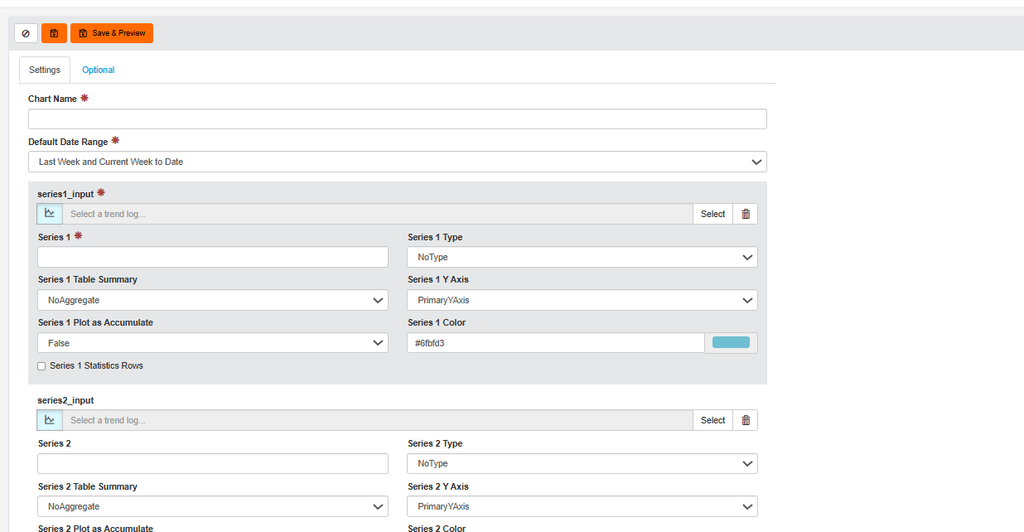
- Enter a name, for example “VAV_08_01 Temperatures”.
- Set the default date range. This is what loads whenever someone opens the chart, for example last week and current week to date.

Select Your Trend Logs
- Click Select on a series input. Search and filter by TL, WT, CTL or Imported TL.
- Add up to 20 trends. Each becomes its own series.
- Give each series a clear name, for example “Space Temp” and “Space Temp SP”, so the legend is easy to read.
Choose How Each Series Displays
- Set the Series Type: line, stacked bar, area, individual bars, scatter, or no type for a table-only series.
- Set the Table Summary (average, maximum or sum) and the Y Axis (primary, secondary or tertiary).
- Click Save & Preview to see the chart and its data table update together.
Fine-Tune on the Optional Tab
- Set the graph title shown above the chart.
- Adjust line style (dashed or dotted), line width, marker shape and marker size.
- Rename the axes and set decimal places. For example, change the default “kWh” to “Degrees C” for a temperature chart.
Turn the Chart into a Report
- On the Charts page, open your chart and click Create Report.
- Add logos and set the date range the report covers each time it runs.
- Set the email schedule: daily, weekly or monthly, with the time and day it goes out.
- Save the report.
Bulk-Create Reports
To set up several charts as reports at once:
- Click the Reports tab and click Bulk Create.
- Select every chart that shares the same logos, date range and schedule.
- Click Create Reports. All selected charts become reports in one step.
